Capture
Surveyors record GPS positions, forms, photos, and evidence offline — already tied to the right project objects.
 datasolutions.rw
From field survey to checked network design — without retyping the same data.
Surveyors, designers, and project managers work from one controlled record for poles, lines, transformers, customers, evidence, quantities, and approvals. Capture offline, design on governed data, and regenerate every deliverable when the design changes.
The product in 30 seconds
Data Solutions is one shared project workspace for electrical-infrastructure delivery.
Surveyors record GPS positions, forms, photos, and evidence offline — already tied to the right project objects.
Engineers clean, connect, calculate, and review the network on that same governed record.
Maps, BOQs, PDF packs, GIS files, and PLS-CADD exchanges regenerate from the approved design.
Built for: utilities, engineering firms, EPC contractors, and survey/design teams. Result: fewer handoff errors, faster revisions, and one result everyone can trace.
Data Solutions did not begin as a theoretical software idea. It grew from our team members’ decades-long experience with the practical data problems that appear across survey, design, construction, reporting, and project handover.
For years, the work moved through CAD, BIM, GIS, spreadsheets, PDFs, field notebooks, email attachments, KMZ files, SHP files, CSV files, XLSX files, and manual checks. Those tools were useful. They still are. The obstacle was that project truth kept spreading across too many places.
On complex infrastructure projects, the work is blocked not only by engineering complexity, but by data reliability and data governance: how data is named, checked, joined, traced, shared, updated, approved, and trusted across many teams.
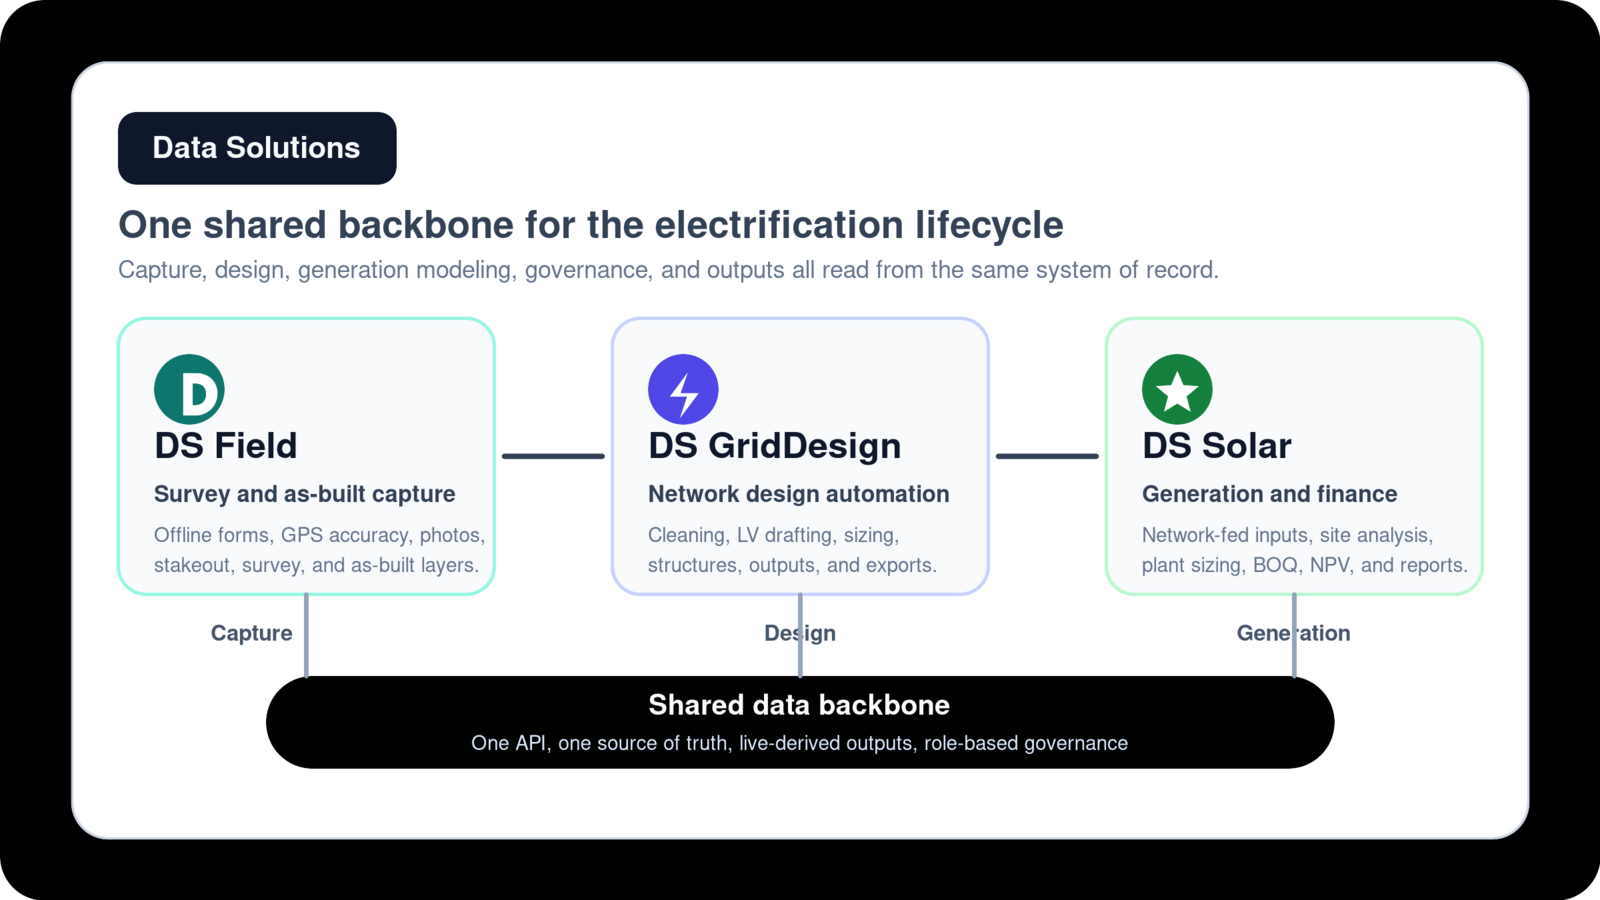
That backbone is the product idea. DS Field, DS GridDesign, and DS Solar are not separate systems passing files between one another. They are different work surfaces over the same governed project data. The surveyor, designer, manager, and analyst see different tools, but they are not arguing with different databases.
Rural electrification made this visible because the workflow is not only one thing. A greenfield extension may begin with route planning, demand areas, reference layers, and design assumptions. A fill-in may begin with a partially known feeder and missing service connections. A reinforcement or as-built project may begin with existing assets that must be verified in the field. In all cases, the same record has to survive design, approval, procurement, construction, and handover.
Inside that loop, small inconsistencies become expensive. One drafter
writes a cable as ABC 4x50, another as
ABC 4 x 50, another as 4x50 ABC, another as
A.B.C 4*50 mm2, and another as ABC 3x50+54.6.
A structure that should be S190 appears elsewhere as
190S, S-190, or simply 190. With
many GIS and CAD drafters working in parallel, joining design layers and
regenerating maps, BOQs, schedules, reports, and exports after a small
change could take days.
Same cable. Five names. One avoidable delay.
The field side had the same lesson. A point, photo, spreadsheet row, design correction, survey form, KMZ, or shapefile is not enough if the project team cannot trace where it came from, who changed it, what evidence supports it, and whether it passed the required checks. In our delivery work across as-built, reinforcement, and field-to-office engineering workflows, confidence improved when field records carried evidence, status, and ownership instead of becoming loose files to interpret later.
We built Data Solutions by solving these problems in our own delivery work first. Governance and transparent data flow are the foundation; encoded domain rules and network graph computations do the predictable engineering work on top of it: pole generation, service drops, load stamping, cable and phase rules, structure assignment, assemblies, stays, earthing, and local-code checks. The engineer sets the design intent; the system carries the repeatable engineering.
Data Solutions was spun off from Engineering Data Solutions so that other engineering firms, utilities, EPC contractors, agencies, and project teams could use the same reproducible workflow system in their own work.
Data Solutions is a data management system for engineering workflows. It handles geographic data because poles, lines, transformers, customers, photos, routes, sites, and assets all have location. But the product is wider than a map: it keeps the project record controlled from capture to output.
Forms, coordinates, photos, documents, attachments, PDFs, audio, video, scanned evidence, accuracy, and survey status.
Routes, poles, spans, transformers, customers, service drops, relationships, rules, standards, and calculations.
Project scope, work packages, responsibilities, roles, review states, lifecycle states, dashboards, and submissions.
BOQs, BOMs, schedules, maps, KMZ/KML, SHP, GeoJSON, XLSX, PDF packs, reports, and approval-ready deliverables.
The Data Solutions platform is sold as a product ecosystem, but the products are not isolated silos. They are role-specific surfaces over one API and one controlled data backbone. Customers license the system to run their own survey, design, reporting, governance, and power-generation planning workflows.
DS Field DS GridDesign DS Solar Shared API Form Factory Style Center Project management PLS-CADD interoperability AI assistant Automatic dashboards
Two platform tools make the data model usable by real teams.
Teams define exactly what must be captured: text, numbers, select lists, geometry, evidence, validation rules, signatures, dates, controlled values, accuracy thresholds, and project-specific controls for each record type. Forms can require field presence, supporting media, and approved values before a record is accepted or flagged for review.
The result is not another spreadsheet template; it is a governed capture contract that field crews, office reviewers, and client teams can all trust.
Layer colours, labels, symbols, icons, line styles, and map presentation rules are managed centrally and reused across projects. The same domain object stays recognizable in field views, office maps, exported KMZ/SHP/GeoJSON packages, and printed map outputs.
Styled once, reused everywhere: the visual language remains consistent from mobile capture to dashboards, Google Earth review, GIS packages, and printed deliverables.
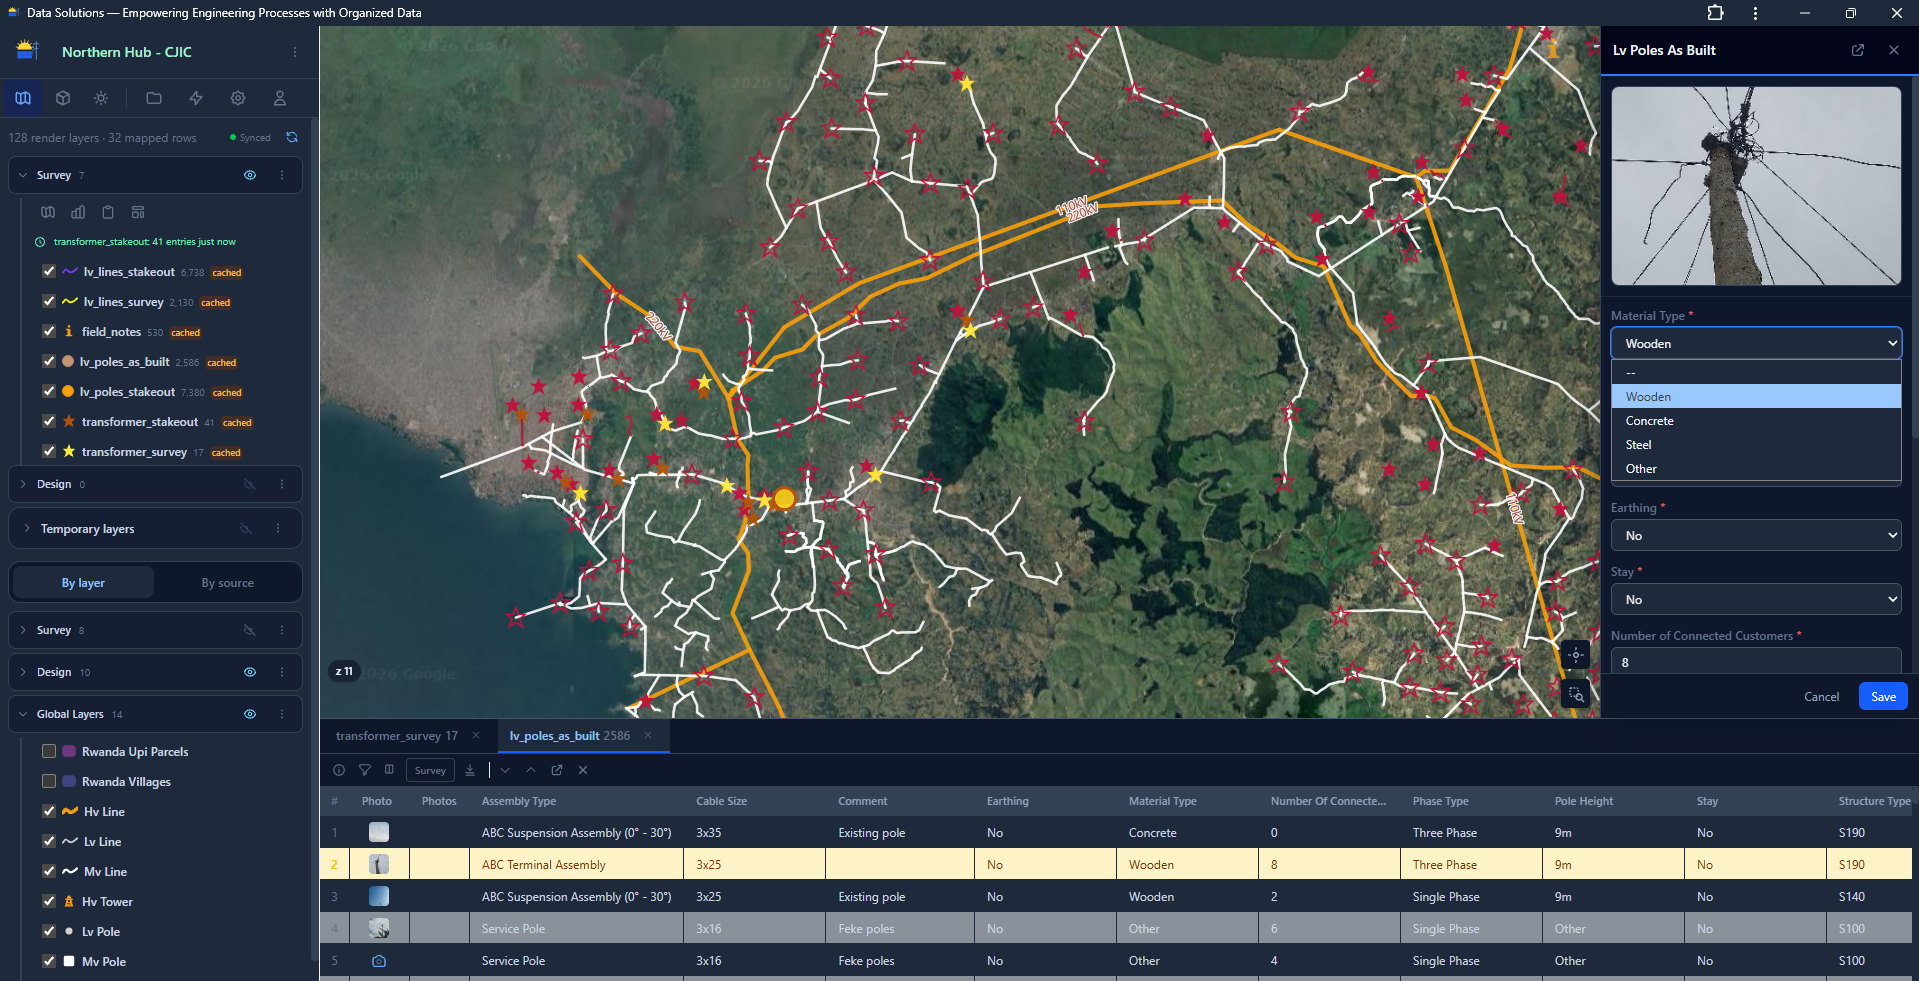
DS Field is the mobile-first, offline-capable field data capture surface for electrification workflows. It supports structured forms, photo-linked records, GPS capture, accuracy controls, field notes, survey points, stakeout work, as-built collection, and project-specific evidence. Depending on how the form is configured, DS Field can require field presence, minimum location accuracy, required evidence, and controlled values before a record is accepted or flagged for review.
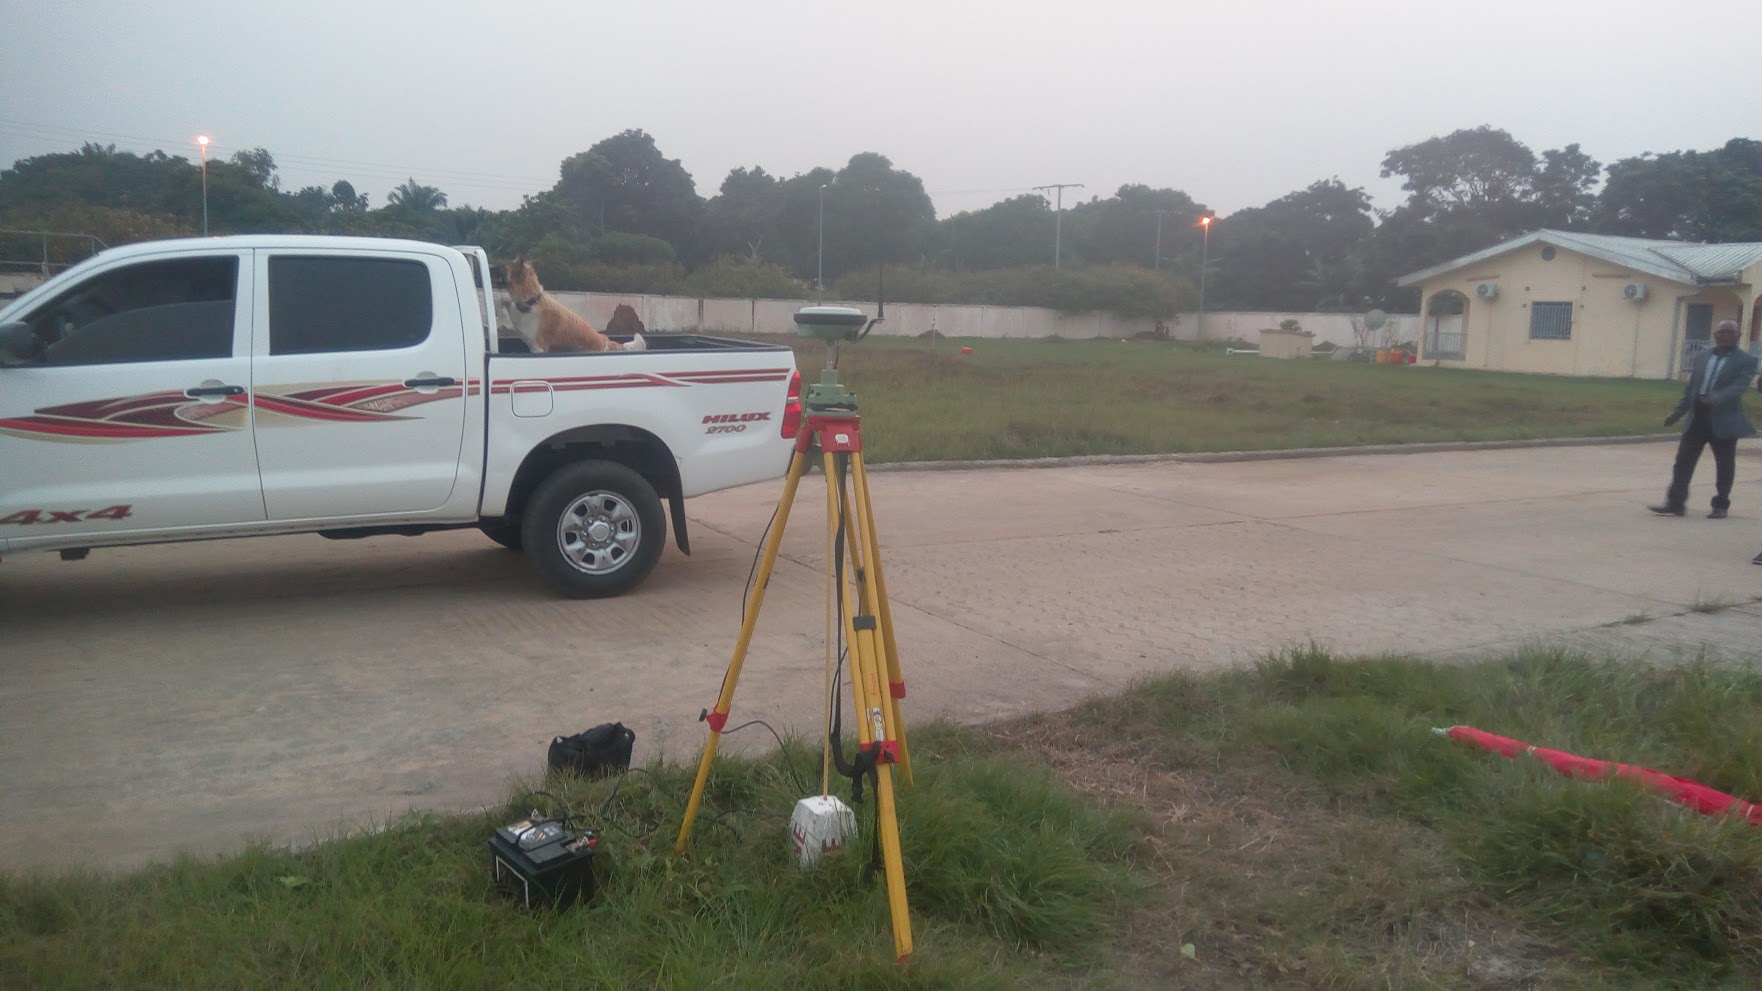
The field team works offline when needed. When connectivity returns, records sync into the governed project workspace with their attributes, evidence, geometry, and status intact. Office users do not wait for copied folders; they review what changed, who captured it, and what still needs attention.
 |
 |
 |
|---|---|---|
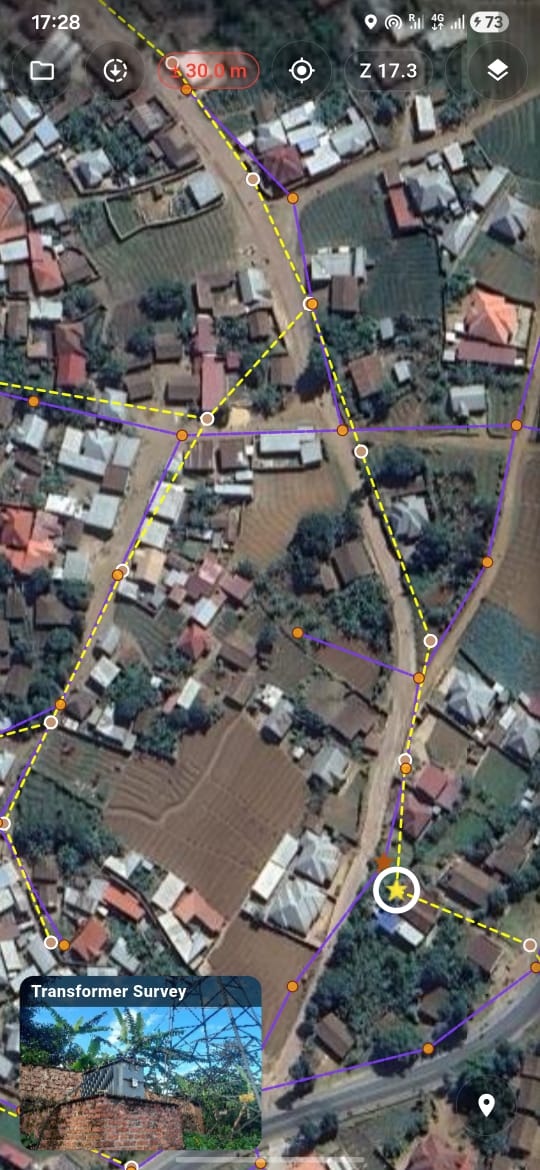
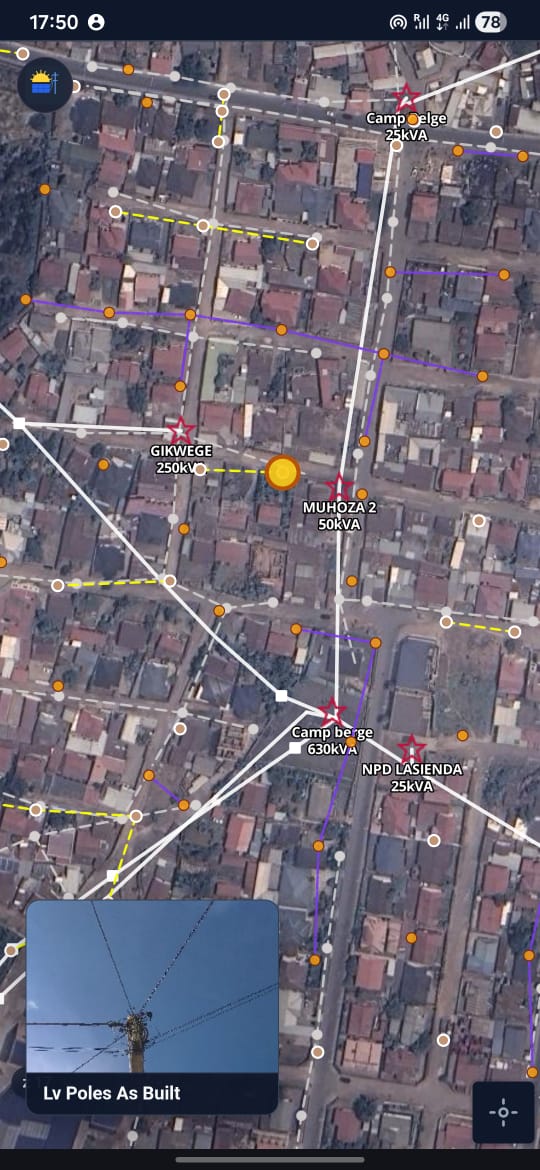
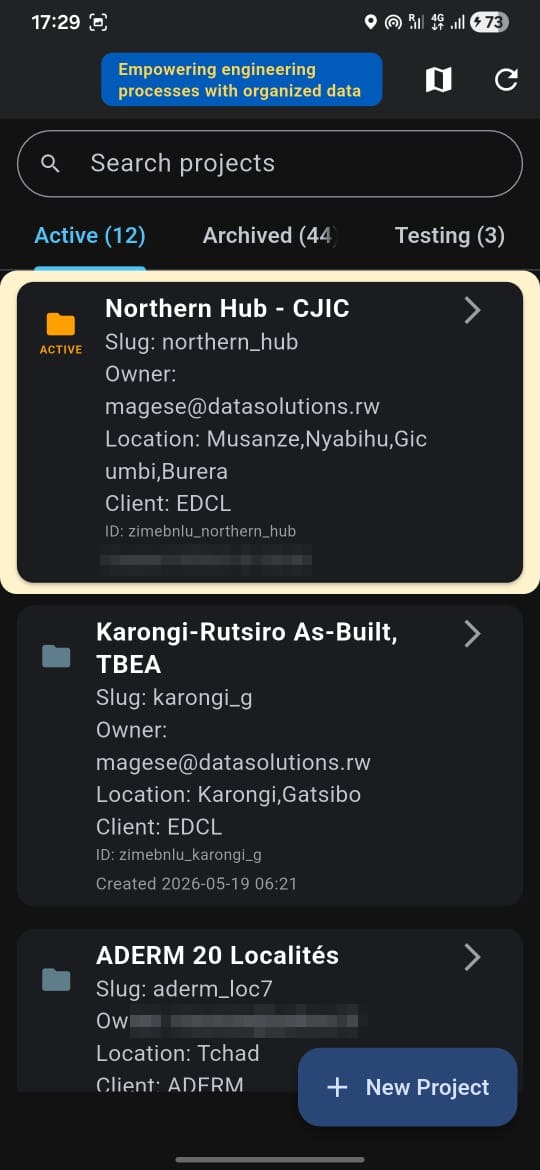
| Survey-point capture with accuracy threshold and structured form. | Dense urban as-built capture: existing assets and service drops are recorded as data. | Project workspaces scope active, archived, and testing work so each team sees the right records for the right job. |
The visible rhythm is simple: scope the project, capture or verify the facts the workflow needs, and keep the work inside the same governed record. In a greenfield package that may mean route reconnaissance, stakeout, obstacles, and progress evidence. In a fill-in or reinforcement package, it may mean missing customers, service drops, existing poles, transformer conditions, and local corrections.
The deeper value is that DS Field does not stop at photos and map pins. It lets crews capture the network as a connected field record, which matters because existing infrastructure is often congested, layered, and difficult to interpret from a desk.
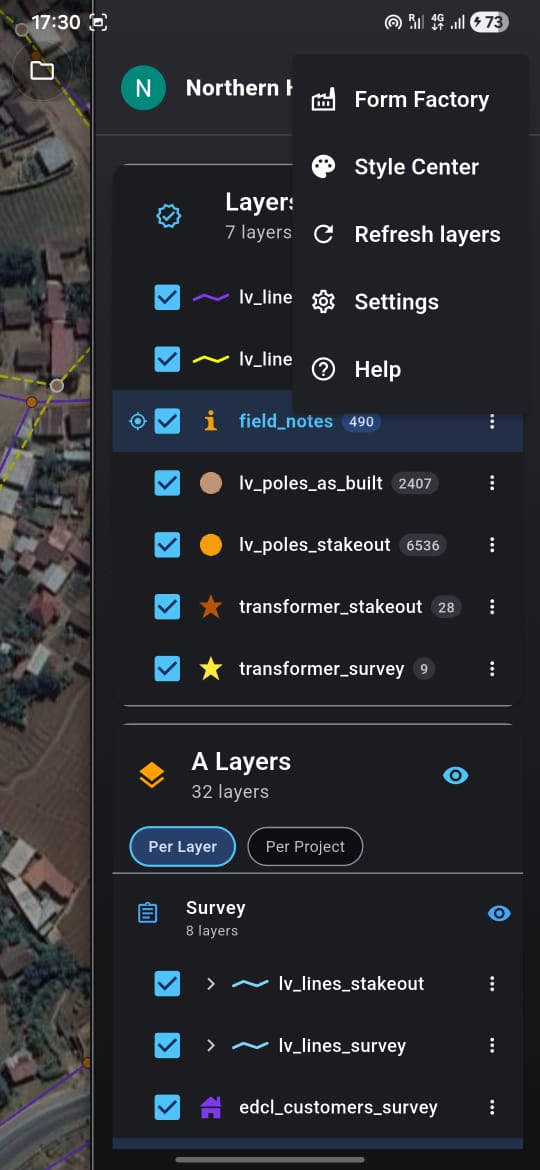
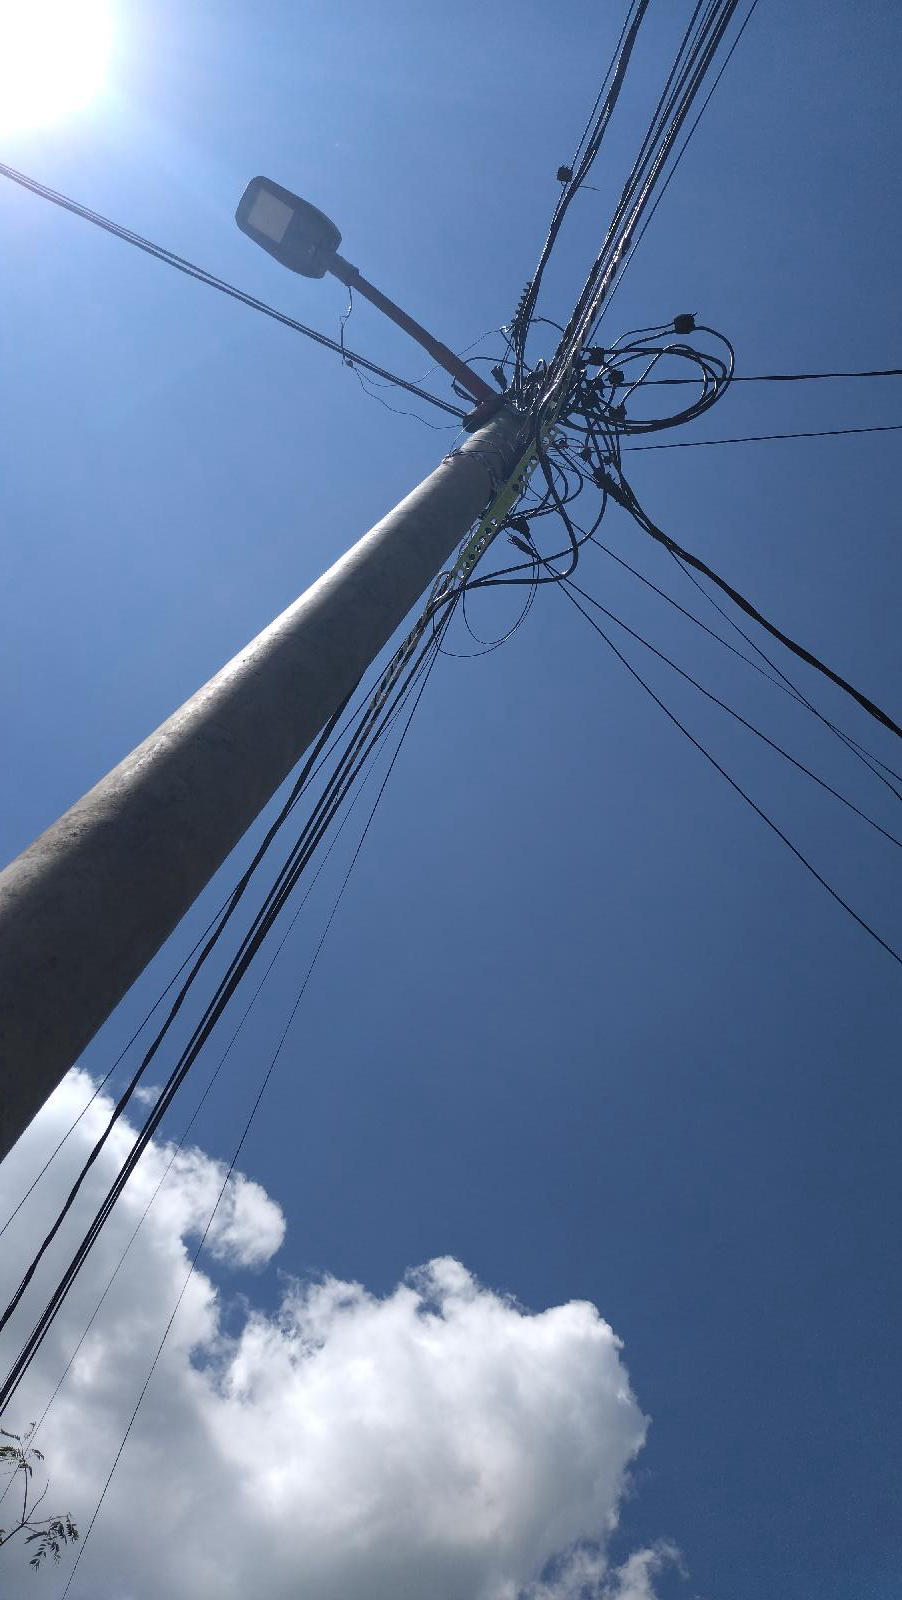
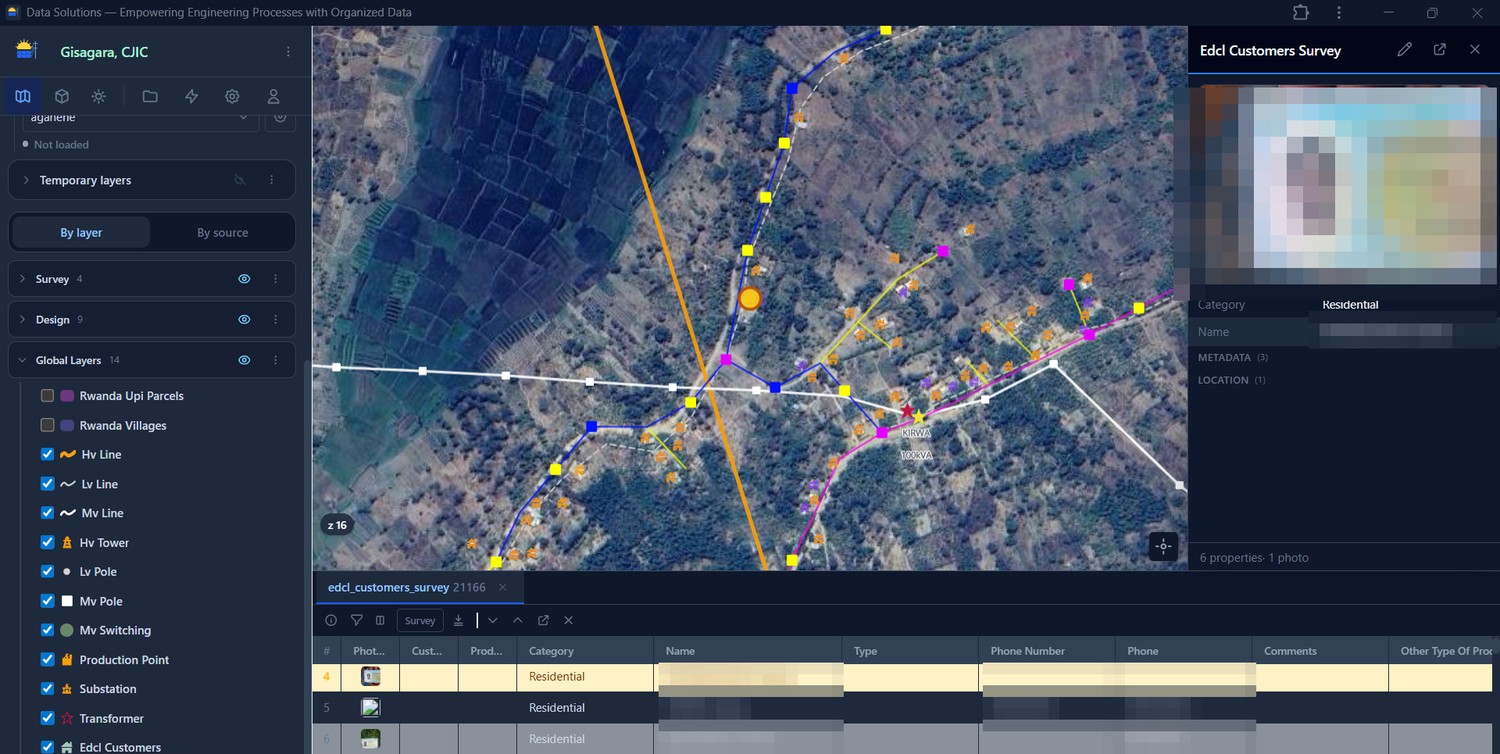
Structured capture beside field reality: DS Field layers organize survey, stakeout, as-built records, field notes, poles, transformers, customers, Form Factory, and Style Center around real existing network conditions.
Electrical network connectivity starts on site, without field drafting. Capture it, snap it, and the network carries meaning from the field.
Crews use the simplest possible connectivity model: capture the object, snap it to the right field feature, and let the app auto-connect records through simple predecessor and antecedent rules.
The surveyor does not carry the cognitive load of drawing network linework in the field. The office receives a connected project model that already carries network meaning, evidence, and per-layer context.
Dense reinforcement and as-built work is where this matters most. Existing poles, transformers, service drops, customer connections, site constraints, photos, and local notes must become facts, not memories to be retyped later. Well-designed forms help survey teams, design teams, client engineers, and contractors discuss the same record instead of defending separate files. Review becomes calmer because the question changes from “who has the latest file?” to “what does this record show?”
DS GridDesign is the electrical distribution network design environment for greenfield or free network extension, fill-ins, mini-grid planning, as-built conversion, and network reinforcement. It is where imported GIS/CAD designs, validated field records, utility reference data, network rules, and engineering outputs come together.
Project data reaches the workstation through several paths: existing designs, reference layers, scoped design packages, DS Field records, and client or utility datasets. Where survey is part of the workflow, most quality control is handled at the form level in DS Field: required attributes, evidence, location accuracy, controlled values, and simple connectivity. GridDesign therefore starts from a governed project record, not from an office reconstruction exercise or a loose bundle of files. Field and office teams work against the same project database through the same API.
Engineers use the workstation to:
Design controls. Existing and new assets can be checked on one canvas; per-feature status stays visible during review; project standards can be configured and revised as requirements are clarified.
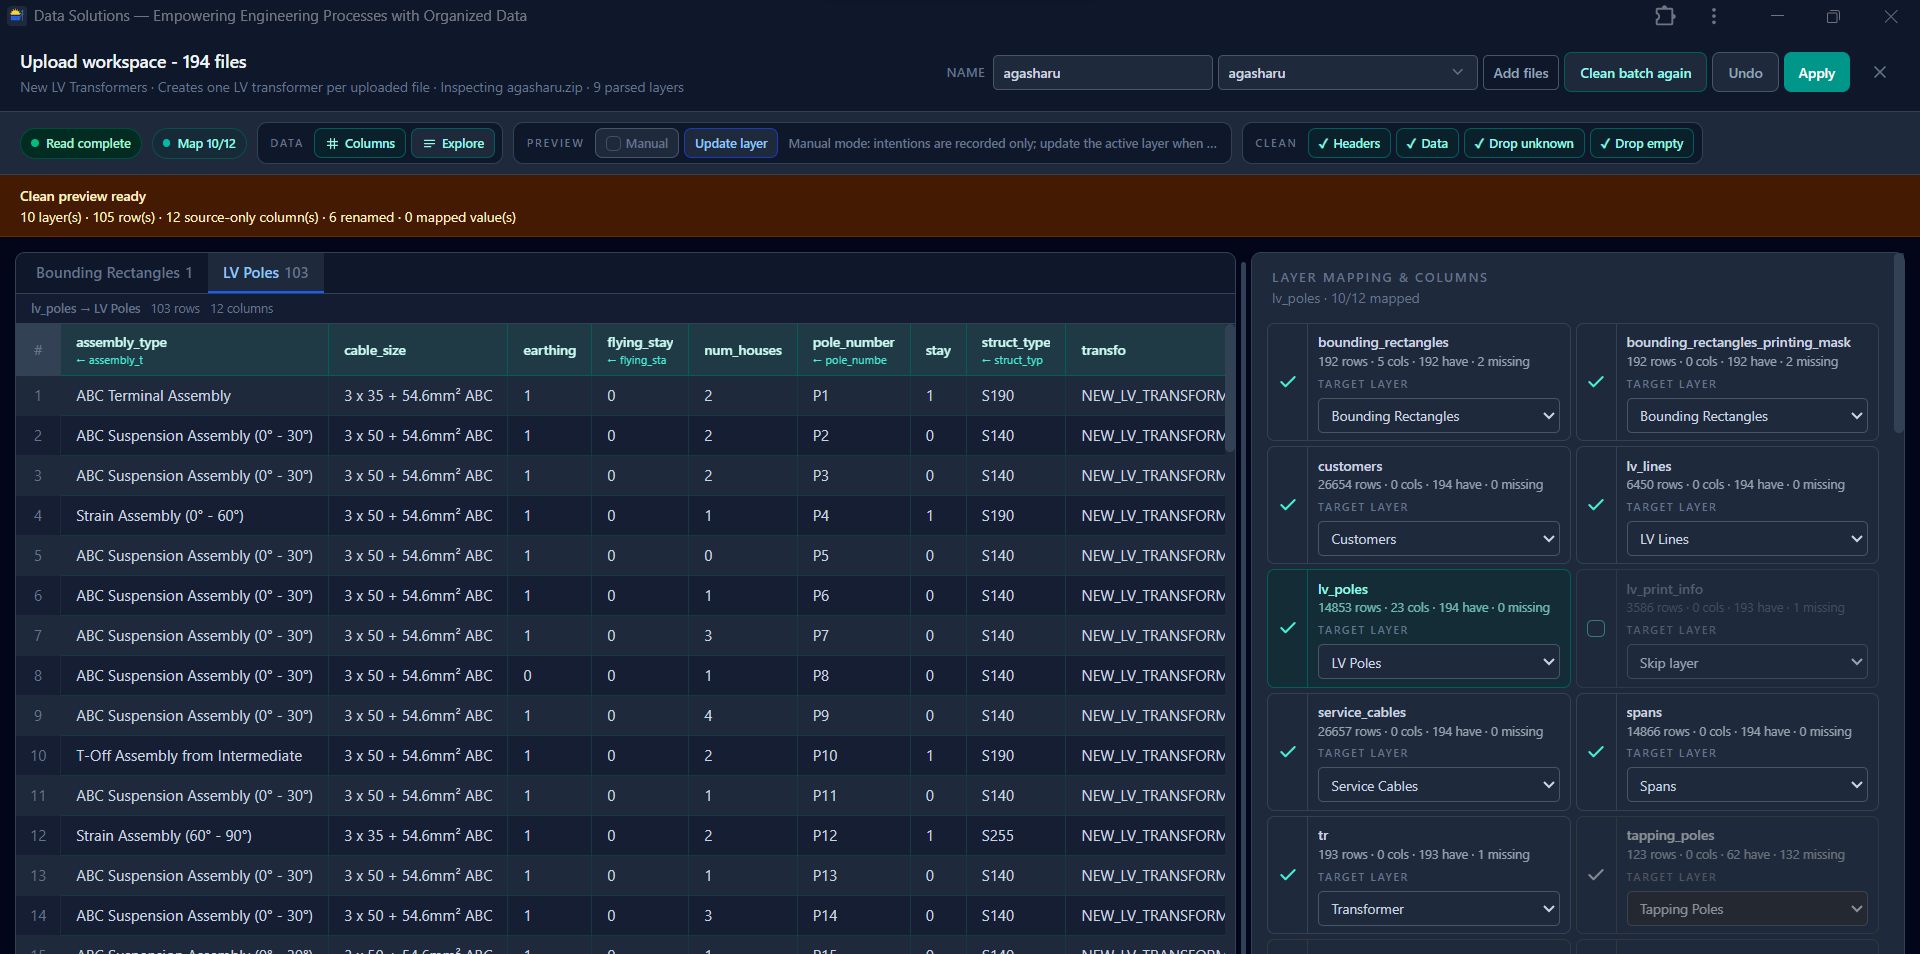
Before engineering automation starts, source data has to be made dependable. DS GridDesign provides a cleaning and upload workspace where teams can inspect files, map source columns into the domain model, map layers to the right target layers, rename inconsistent attributes, drop unknown or empty fields when appropriate, and preview actual rows before committing data.
The point is not only import convenience; it is intake control. Bad naming, missing values, wrong layer mapping, duplicate records, and source-only fields are surfaced before they pollute the live project model.
From the same network model, DS GridDesign runs the predictable checks and mechanical drafting steps that make project data useful to engineering: load-flow and voltage-drop simulation, collision and clearance checks, pole generation, service-drop assignment, cable and phase rules, pole structure assignment, assemblies, stays, earthing inputs, and bill outputs. These rules can be aligned to local codes, utility standards, and client templates.
The configuration is practical, not cosmetic: conductor libraries, structure rules, assemblies, form fields, layer names, labels, report sections, BOQs, and approval templates can be configured where the workflow is standard and customized where local codes or client processes require it.
The important point is traceability. A failed calculation, structure warning, or design correction points back to the affected source feature or design object, not to an anonymous drawing layer.
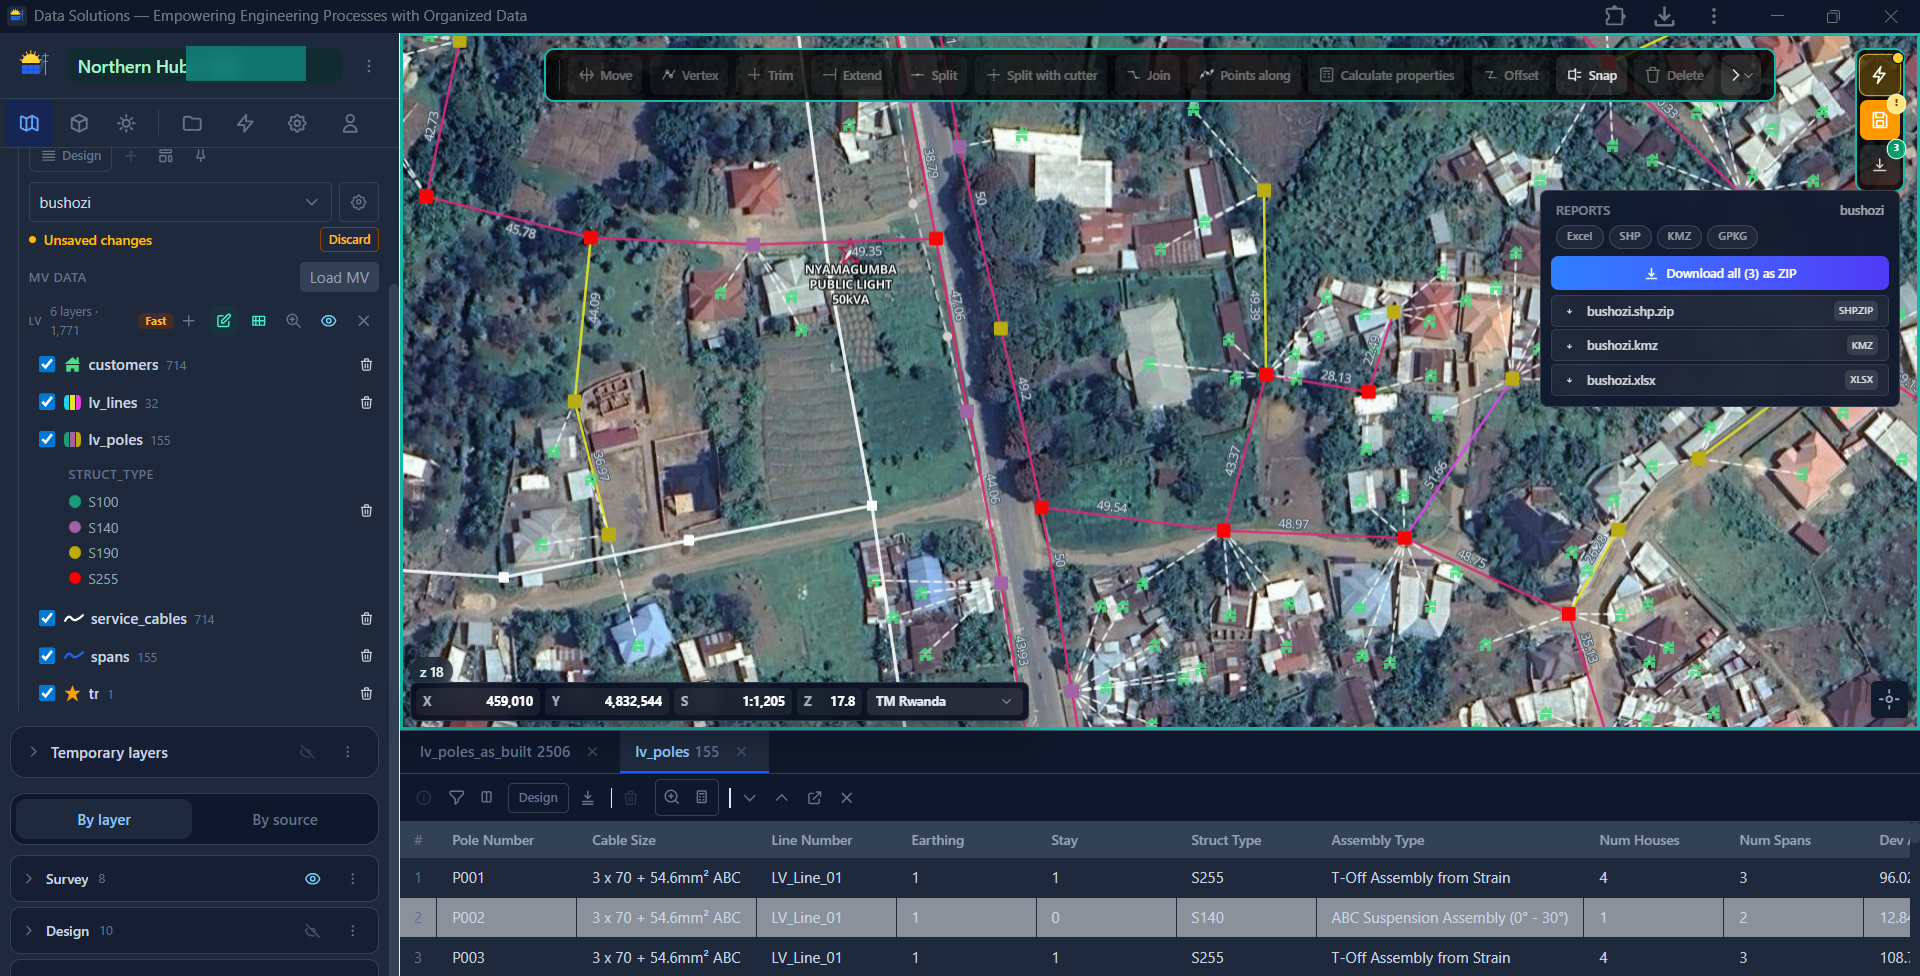
The drafting workspace is the parent view for that work. Its toolbar is deliberately simple and CAD-like: move, edit vertices, trim, extend, split, join, snap, offset, calculate properties, and delete. It is limited by design, but complete for the domain work: poles, spans, LV lines, service drops, customers, attributes, and topology stay connected while the engineer adjusts the design.
From the same workspace, export buttons generate the artifacts other people need: spreadsheets, geospatial packages, KMZ/KML review files, and zipped export bundles.
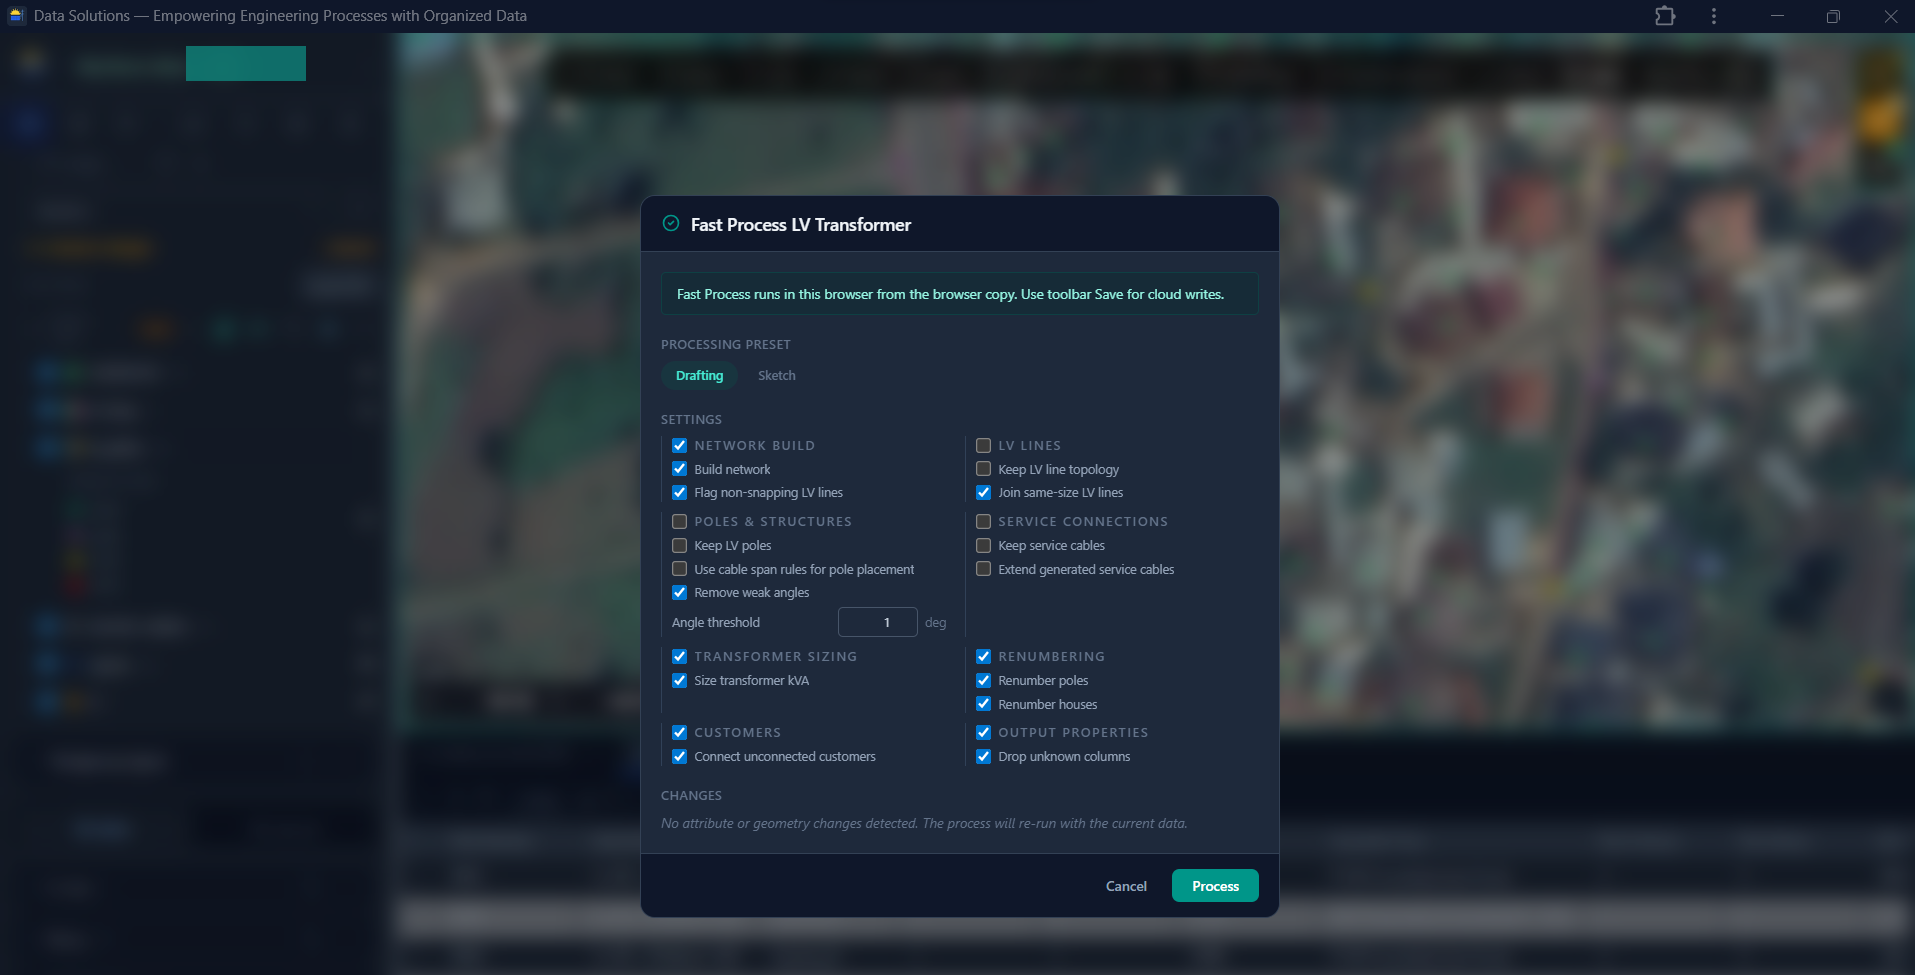
The processing dialog is where engineers choose which repeatable steps should run for the current package: build the network, join LV lines, apply pole and structure rules, size transformers, connect customers, renumber outputs, and write calculated properties.
The controlled data backbone matters most at output time. The differentiator is not that the software draws lines on a map; it is that outputs are controlled by the live data model.
Draft the design once. The PDF printout, styled KMZ/KML for Google Earth, customized XLSX bill of materials and quantities, structure schedule, cable schedule, reports, and data exports are regenerated from the same live source. That is how the platform reduces drift between field data, engineering design, reports, procurement checks, approvals, and client deliverables.
This changes the mood of project reporting. Teams do not need to spend their best energy assembling status narratives from scattered files. They enter the facts, attach the evidence, review the exceptions, and let structured reports and dashboards come out of the system. When facts speak for themselves, handover becomes less anxious, team friction reduces, and trust persists because everyone can trace the same record.
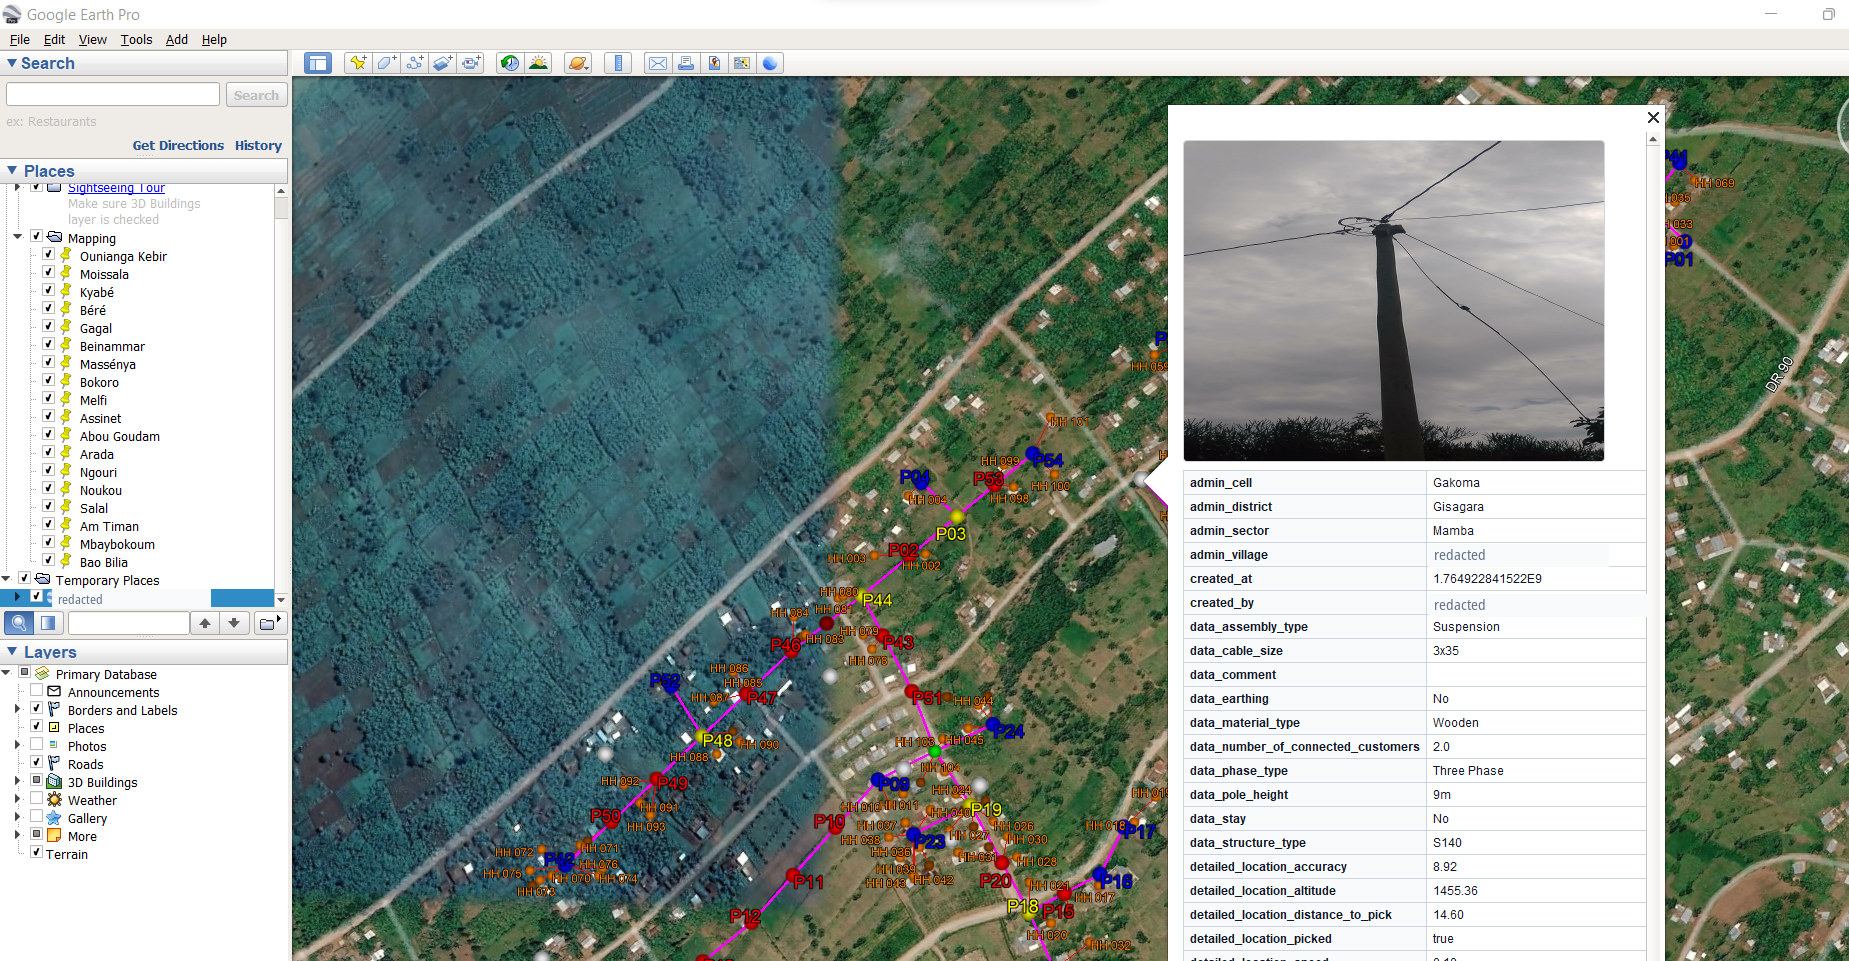 KMZ/KML opens in Google Earth with model-driven styling, labels,
attributes, and surveyed images embedded in the feature record.
KMZ/KML opens in Google Earth with model-driven styling, labels,
attributes, and surveyed images embedded in the feature record.
|
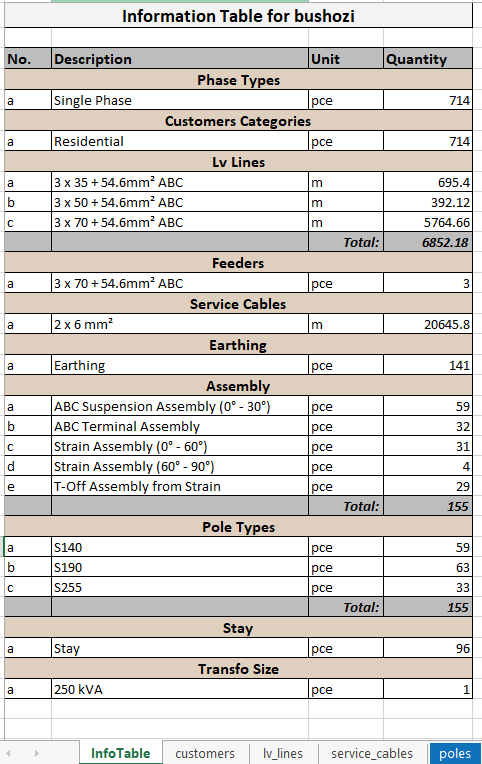 Customized XLSX bill of materials and quantities, aligned to the
client and local standards, preserving the identifiers used in survey
and design.
Customized XLSX bill of materials and quantities, aligned to the
client and local standards, preserving the identifiers used in survey
and design.
|
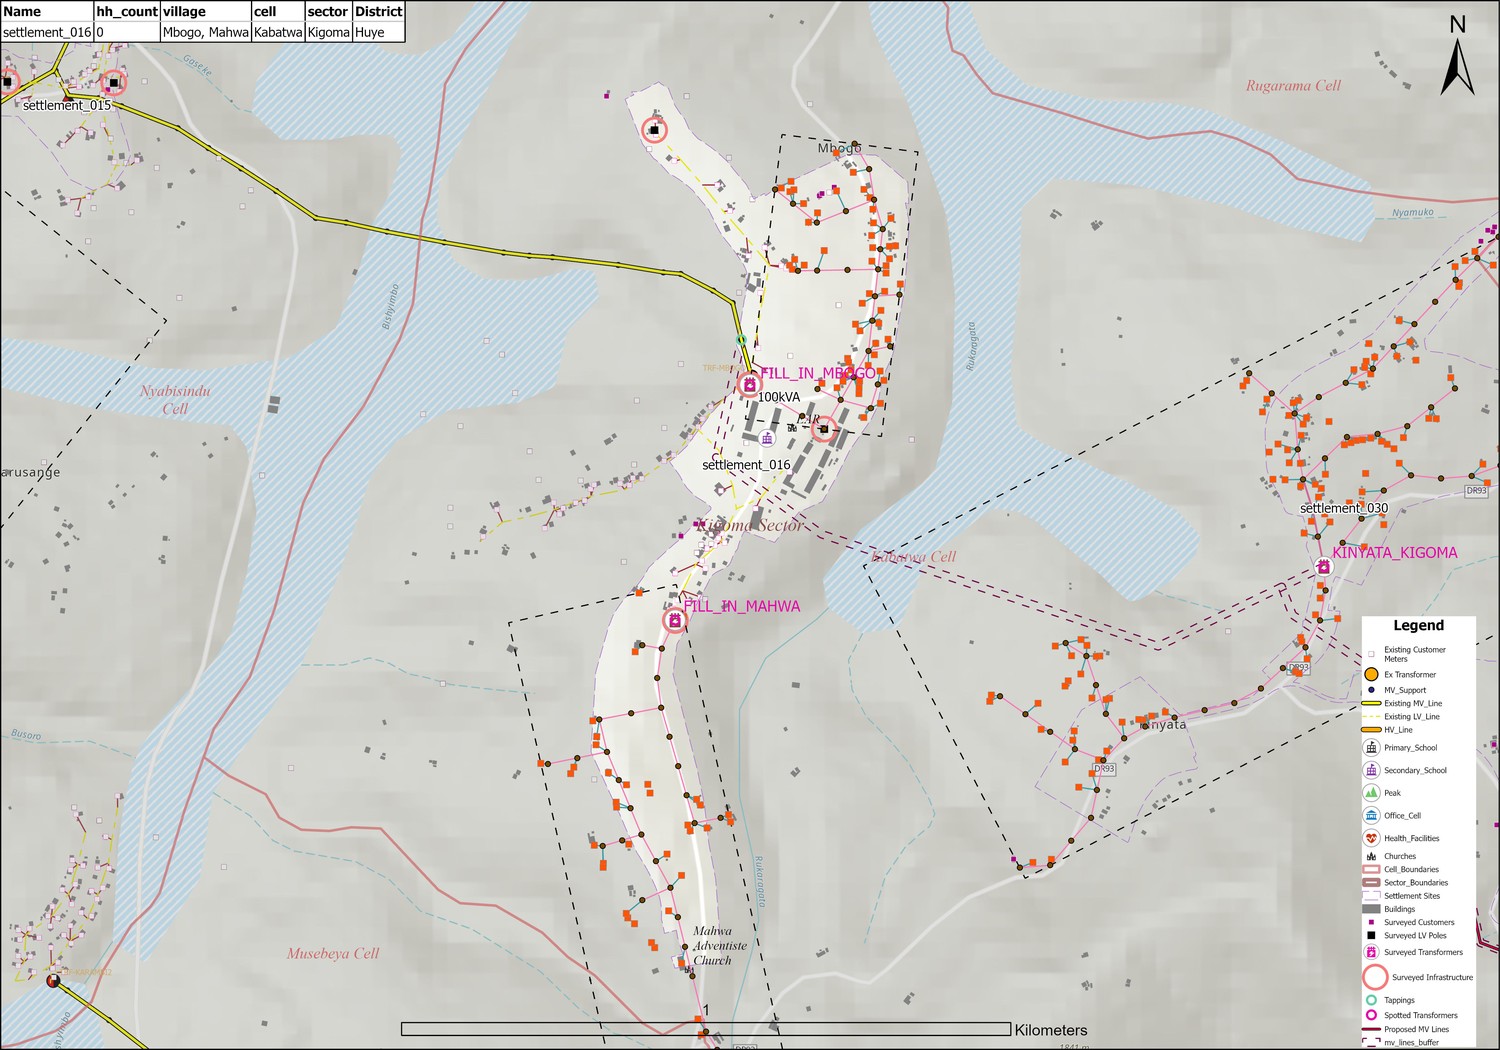 Representative PDF/map printout: georeferenced existing and new
distribution infrastructure for review and engineering packs.
Representative PDF/map printout: georeferenced existing and new
distribution infrastructure for review and engineering packs.
|
Data Solutions is not trying to replace ArcGIS Pro, DS cartography, enterprise GIS, CAD, or Google Earth workflows. Those tools remain useful for broad mapping, cartography, analysis, geodatabases, drafting, review, and organizational spatial-data strategy.
Data Solutions adds the specialized engineering workflow layer around them: survey and design intake, validation, data cleaning, design logic, QA, utility-specific forms, dashboards, network outputs, reports, and field-ready deliverables. Because the workflow is domain-channeled, surveyors, GIS users, CAD technicians, administrators, operators, and managers learn through work they already recognize instead of starting inside a general-purpose GIS maze.
The platform still interoperates with established tools through controlled imports, exports, and APIs. Data can move out to KMZ/KML, GIS formats, Excel, PDF packs, reports, and client templates without rebuilding the source record each time.
Governance is where the data model becomes operational discipline. Records carry ownership, status, evidence, review history, and export readiness, so a reviewer can trace a number, asset, or consumer record without asking the team to reconstruct a folder trail.
Transmission and distribution engineering runs on PLS-CADD. For years the boundary between a governed project record and a PLS-CADD model was crossed by hand: export, reformat, re-key, reconcile, and hope the identifiers survived the trip. The format itself was the barrier, and it charged a fee on every exchange, paid in time and in accuracy.
DS GridDesign speaks PLS-CADD directly. A contractor backup is not a foreign object waiting to be translated; it is a project input.
Drag and drop the .BAK. A PLS-CADD backup, raw or
wrapped in a ZIP, can be dropped anywhere on the map. Nothing is
trusted to the filename: .bak is a generic backup suffix,
so a recognizer reads the contents and confirms a genuine PLS-CADD
backup container before the software offers to do anything with it. The
engineer then decides what it becomes - DS Grid model or models for
full engineering work, or temporary layers for review. Nothing is
written until that choice is made, and a cancelled prompt leaves no
half-imported project behind. Where a file cannot be used, the refusal
is legible: it names the version or capability that is missing instead
of failing quietly.
One workspace. Backups arriving from different contractors, each with its own conventions, land in the same managed workspace and are reconciled against the same project record. The alignment, structures, sections, terrain, and cabling stop being one contractor's private file and become project facts the whole team can trace.
Exports back out. The exchange runs both directions. The design can be exported to PLS-CADD, replacing the managed workspace, so engineering done in the governed model returns to the engineer's own environment without a manual rebuild.
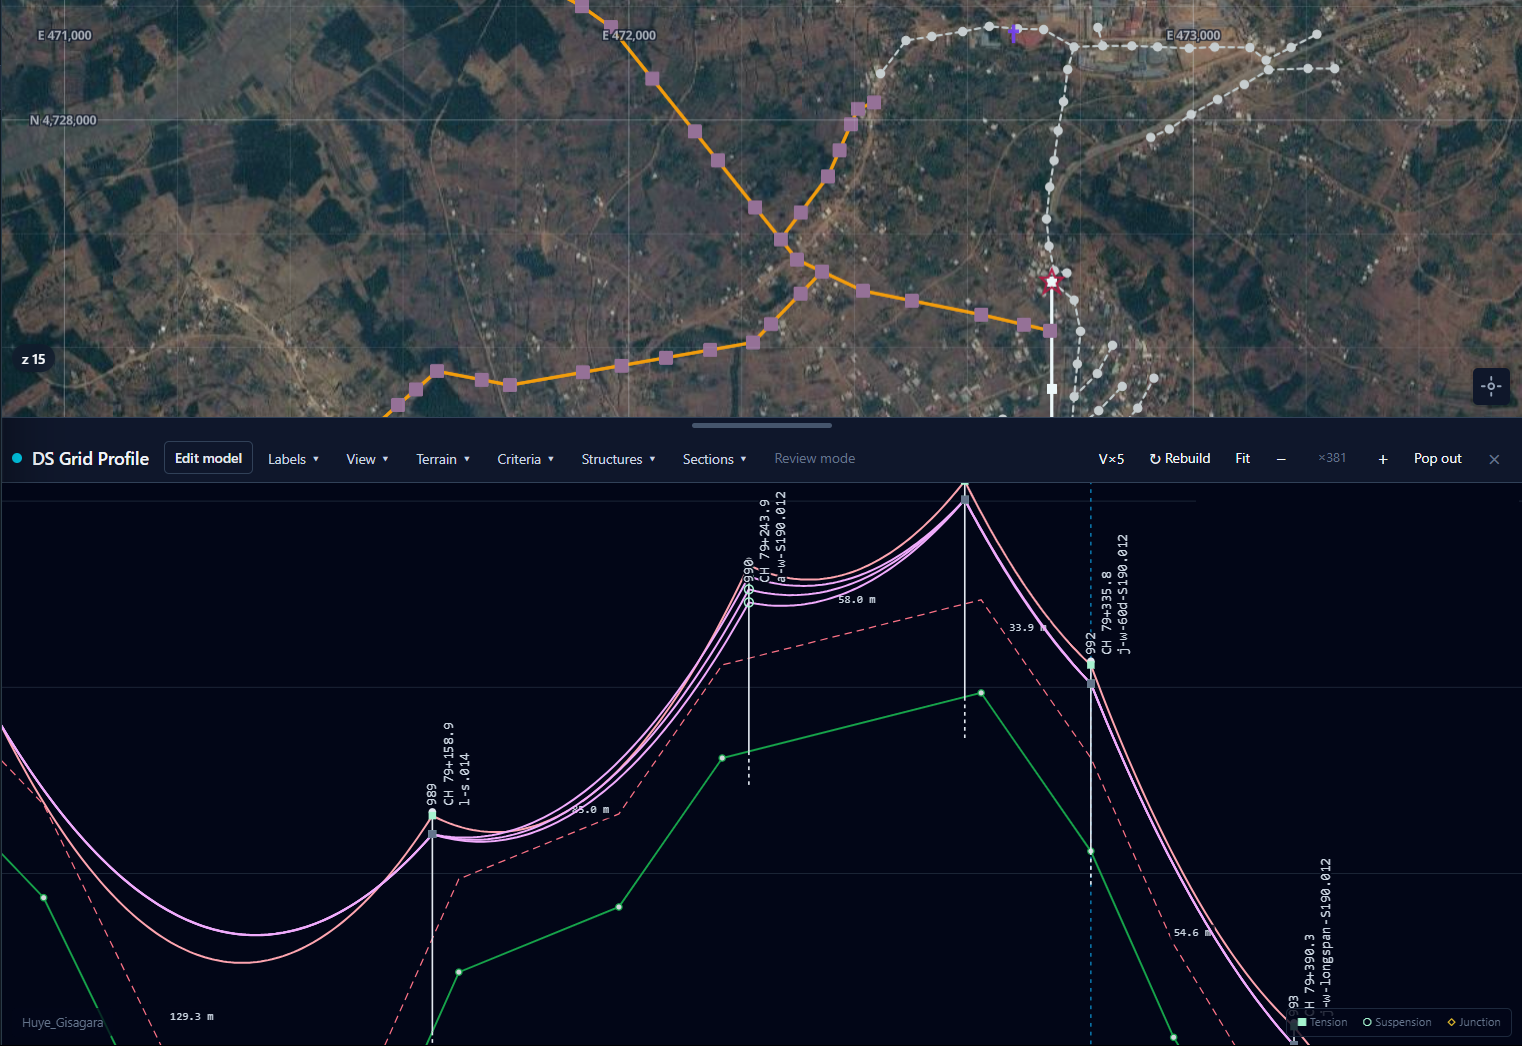
S190.012, 60d, and longspan are
the same controlled names the intake template enforced, not labels
retyped for the drawing.
Breaking the data format barrier. The advantage is not that one more format is supported. It is that the exchange stops being an event. A backup lands and it is understood; a design leaves and it is still the same design. The name an engineer reads on a sag curve is the name the survey form enforced at intake, unbroken.
Engineering correctness was not enough.
With field facts governed, the design model traceable, and every output regenerating from one live record, we had the project's engineering facts in order. The work was still overwhelming. Scope moved while survey was still running. Packages waited on each other in ways nobody had written down. Instructions arrived by email and decisions by phone call. Snags accumulated, and no one could say cleanly which were ours to fix and which were a variation. The engineering was right, and it was still hard to put the project together meaningfully.
That is a different problem, and more correctness in the network model does not touch it. So we introduced project management - not a tracker bolted to the side of the platform, but the same governed record extended to the work itself, shaped like the way we actually survey and design.
Tasks carry the phases delivery actually has: mobilization, site work, monitoring, demobilization, and milestones, arranged in a WBS hierarchy with real dependencies and a project calendar. Delivery, review, and closeout are tracked as separate states, because a task that is built is not the same as a task that is accepted.
The snag list is not a spreadsheet someone keeps privately. Each outstanding item is a record against its task, classified by whether it falls inside the agreed scope or is a variation - so the question that usually surfaces at closeout is answered while the work is still fresh.
Emails, letters, meetings, calls, transmittals, instructions, clarifications, decisions, and submissions are recorded against the project as inbound or outbound context, with their evidence attached. A decision keeps its provenance instead of living in one person's inbox.
Schedule edits pass through the same command discipline as the rest of the record: every change names a committer and a reason category. A date that moved can be traced to why it moved, months later, without asking anyone to remember.
The point is the same one the rest of the platform makes. Progress is derived from the records the team is already keeping, not retyped into a status report at the end of the week. When the schedule, the snags, the correspondence, and the engineering all sit on one project record, reporting stops being an act of reconstruction.
The project surface is not a planning tool sitting beside the work. It is tightly integrated with the data itself - it reads the records where the data actually lives - and with the design actions performed on them. Nobody assembles it. Nobody is asked for a status update.
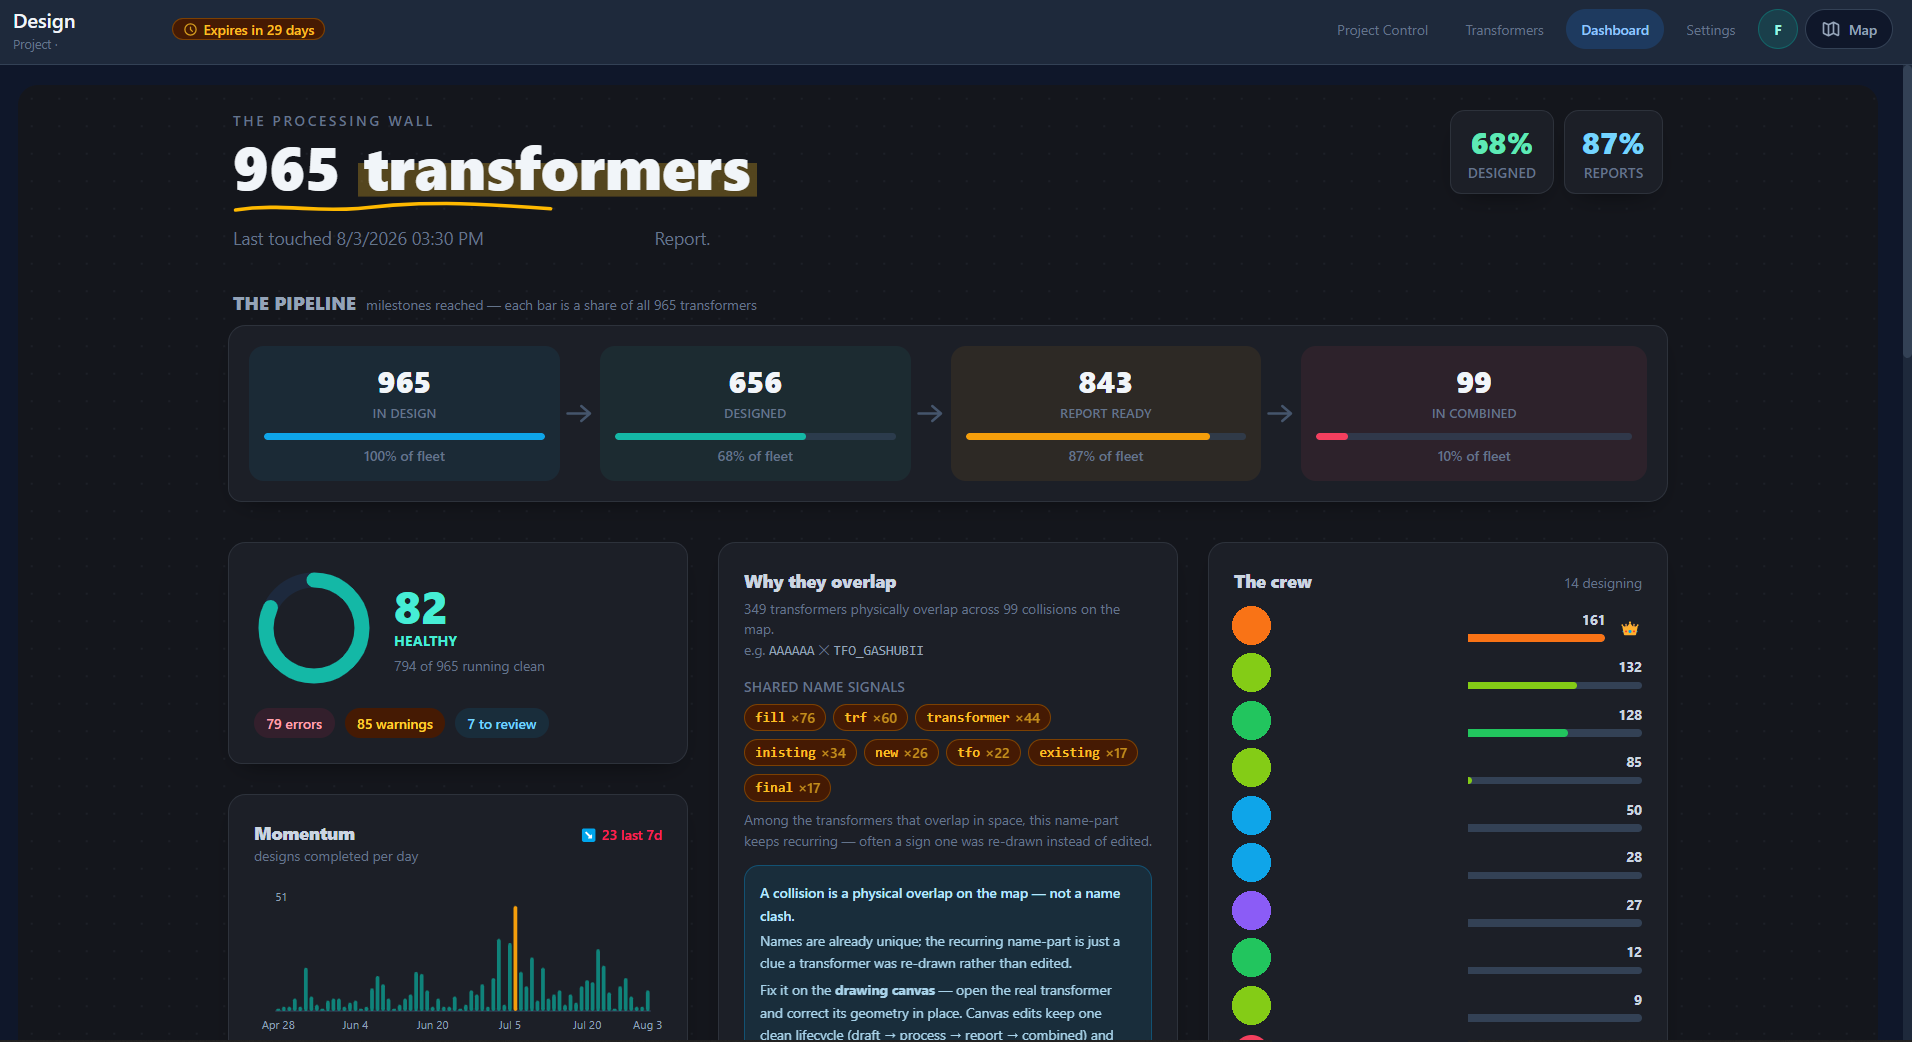
So there is no reporting step. There is a dashboard, and it is already current. It counts the fleet as designed, tracks how much is report-ready, and separates what is healthy from what carries errors, warnings, or items awaiting review. Because it is reading design actions and not a submitted summary, it can also say who drew what: the crew panel is derived from the design record, not from anyone's timesheet.
It goes further than counting. It finds transformers that physically
overlap on the map and distinguishes that from a naming coincidence,
and it surfaces the recurring name fragments - fill,
trf, existing, new - that betray
an asset that was re-drawn instead of edited. Then it points back at
the drawing canvas, where the real object can be corrected in place.
The dashboard is not a mirror held up to the project; it is the same
record, read a different way.
The people who most need to know how a project is going are often the least willing to learn a GIS. A manager should not have to find the right panel, choose the right filter, and read the right column to learn how much survey exists.
So the assistant is not a chatbot bolted onto a help page. It is attached to the project record, answers from the data in that project, and returns the answer as something you can act on - a chart you can interrogate, or a message you can attach to the work itself.
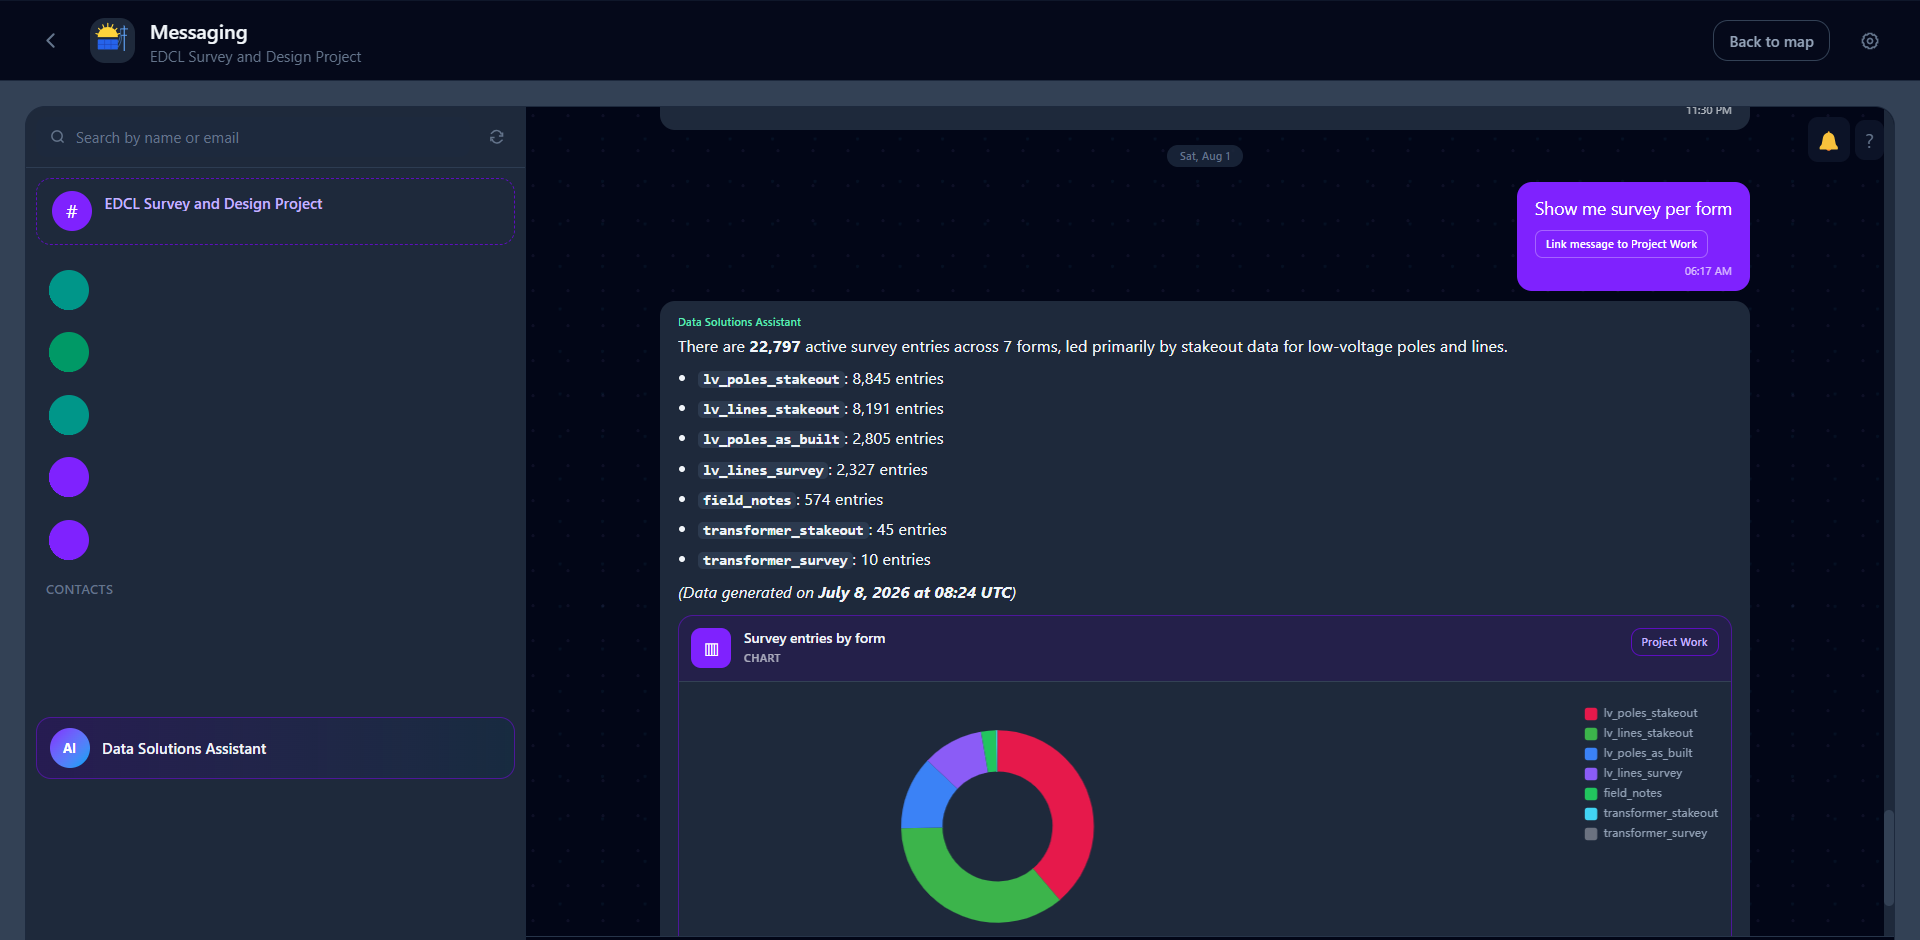
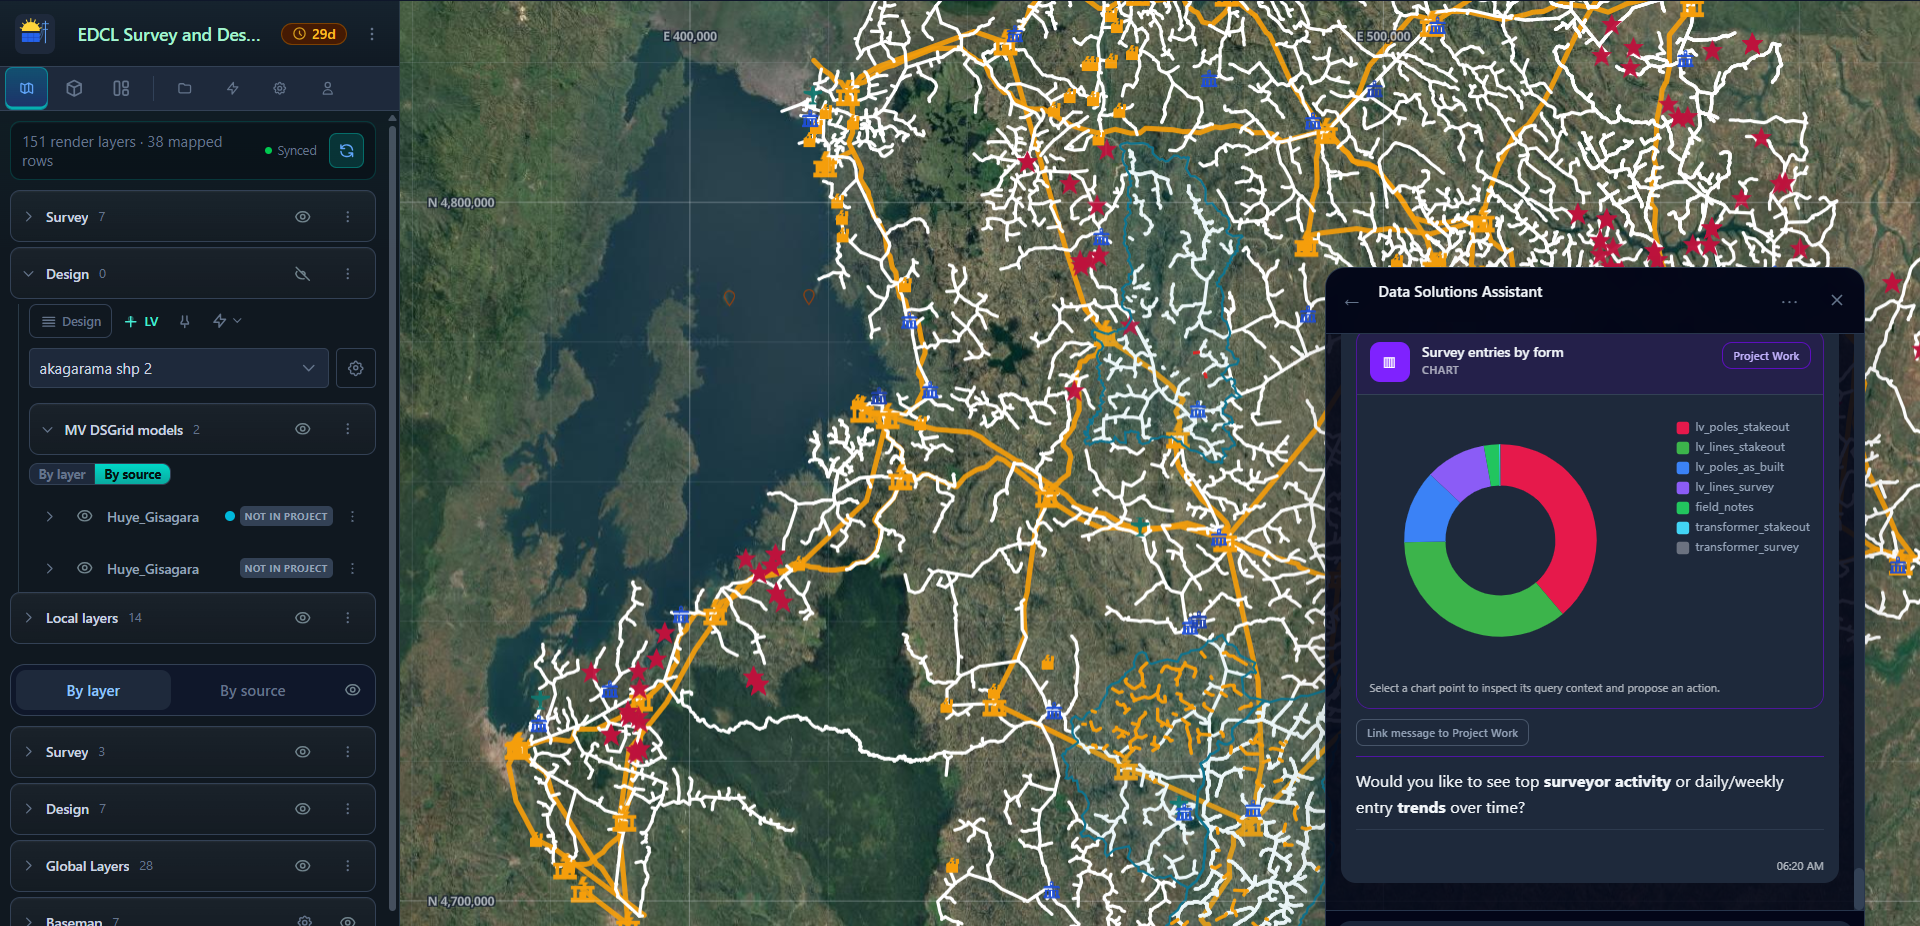
The answer is not a summary of the data; it is the data. Because the assistant queries the governed project record, its reply carries the same identifiers as the map, the design, and the exports. A chart it produces can be linked to Project Work, so a question asked in passing becomes part of the project trail rather than a screenshot in someone's chat.
DS Solar extends the platform from distribution network design into generation planning. It supports portfolio pipelines, site and resource analysis, technical and financial parameters, BOQ workflows, optimization, and financial reporting.
Because network parameters can be derived from DS GridDesign outputs, solar sizing and financial studies do not need to start from blank spreadsheets.
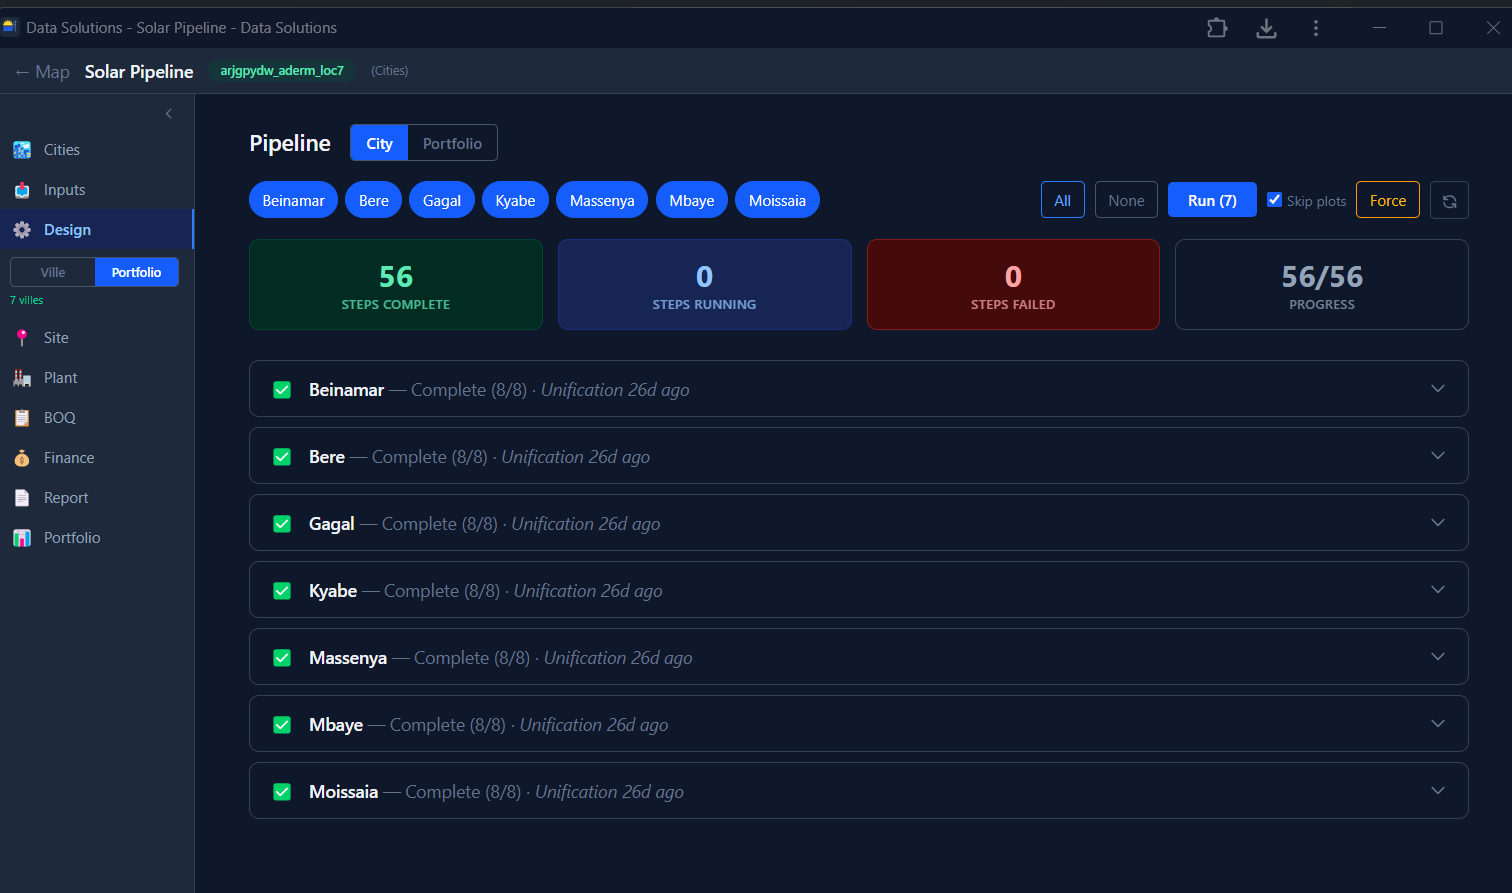
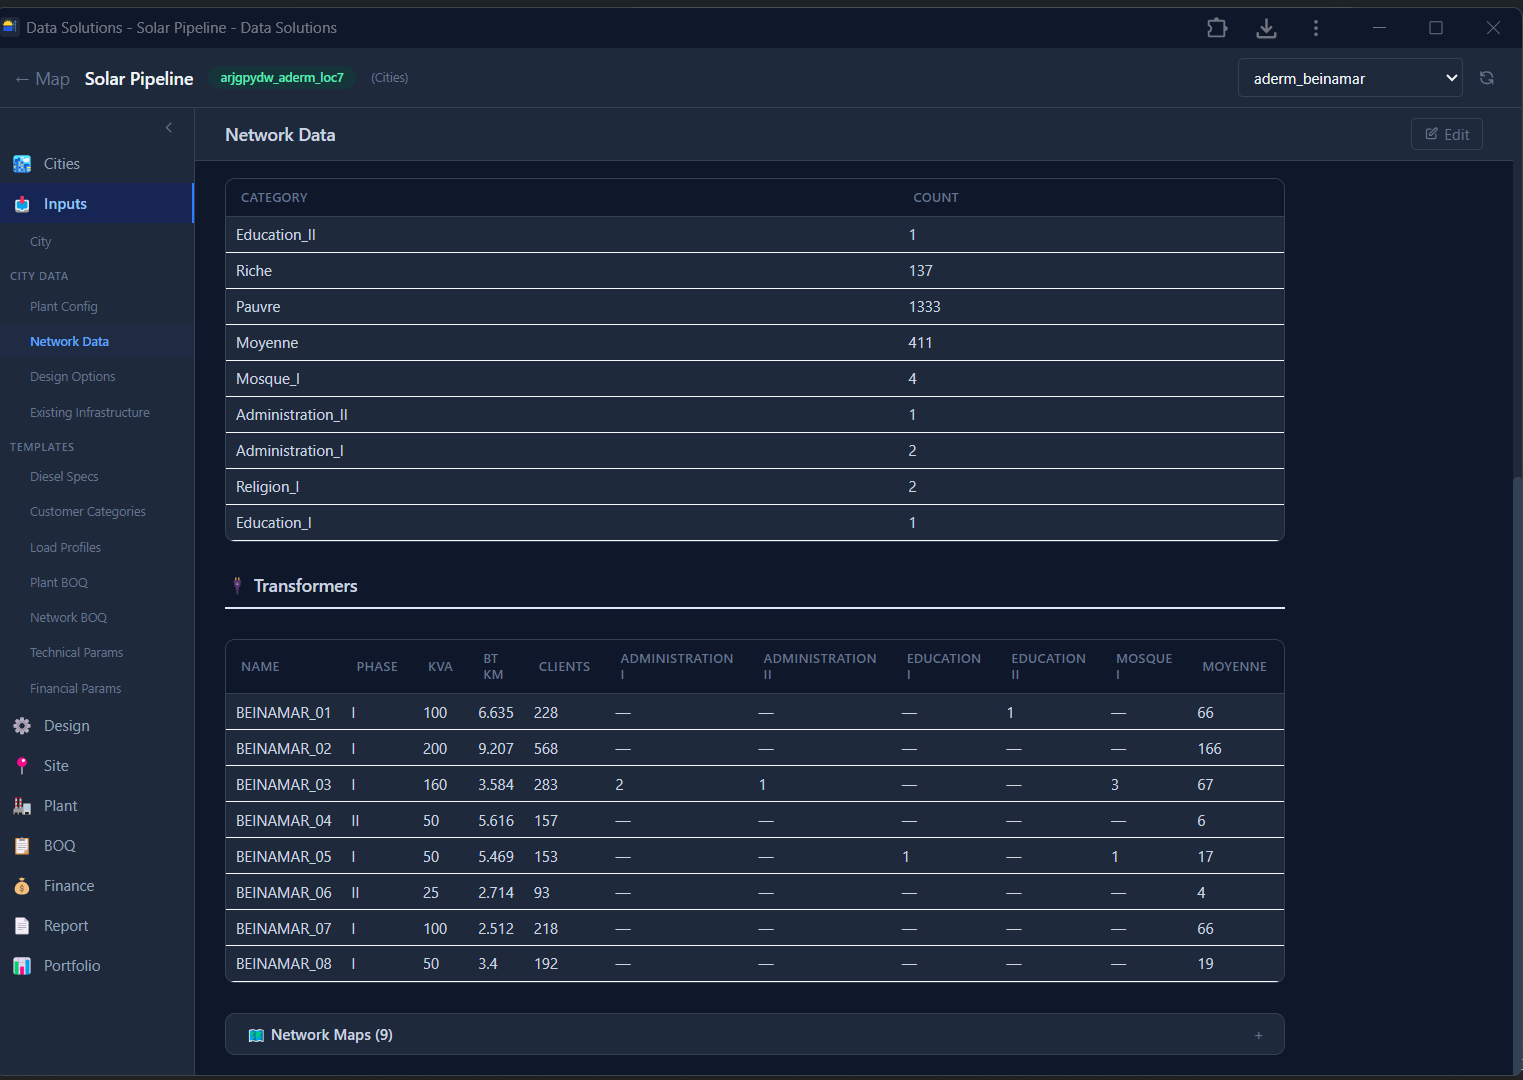
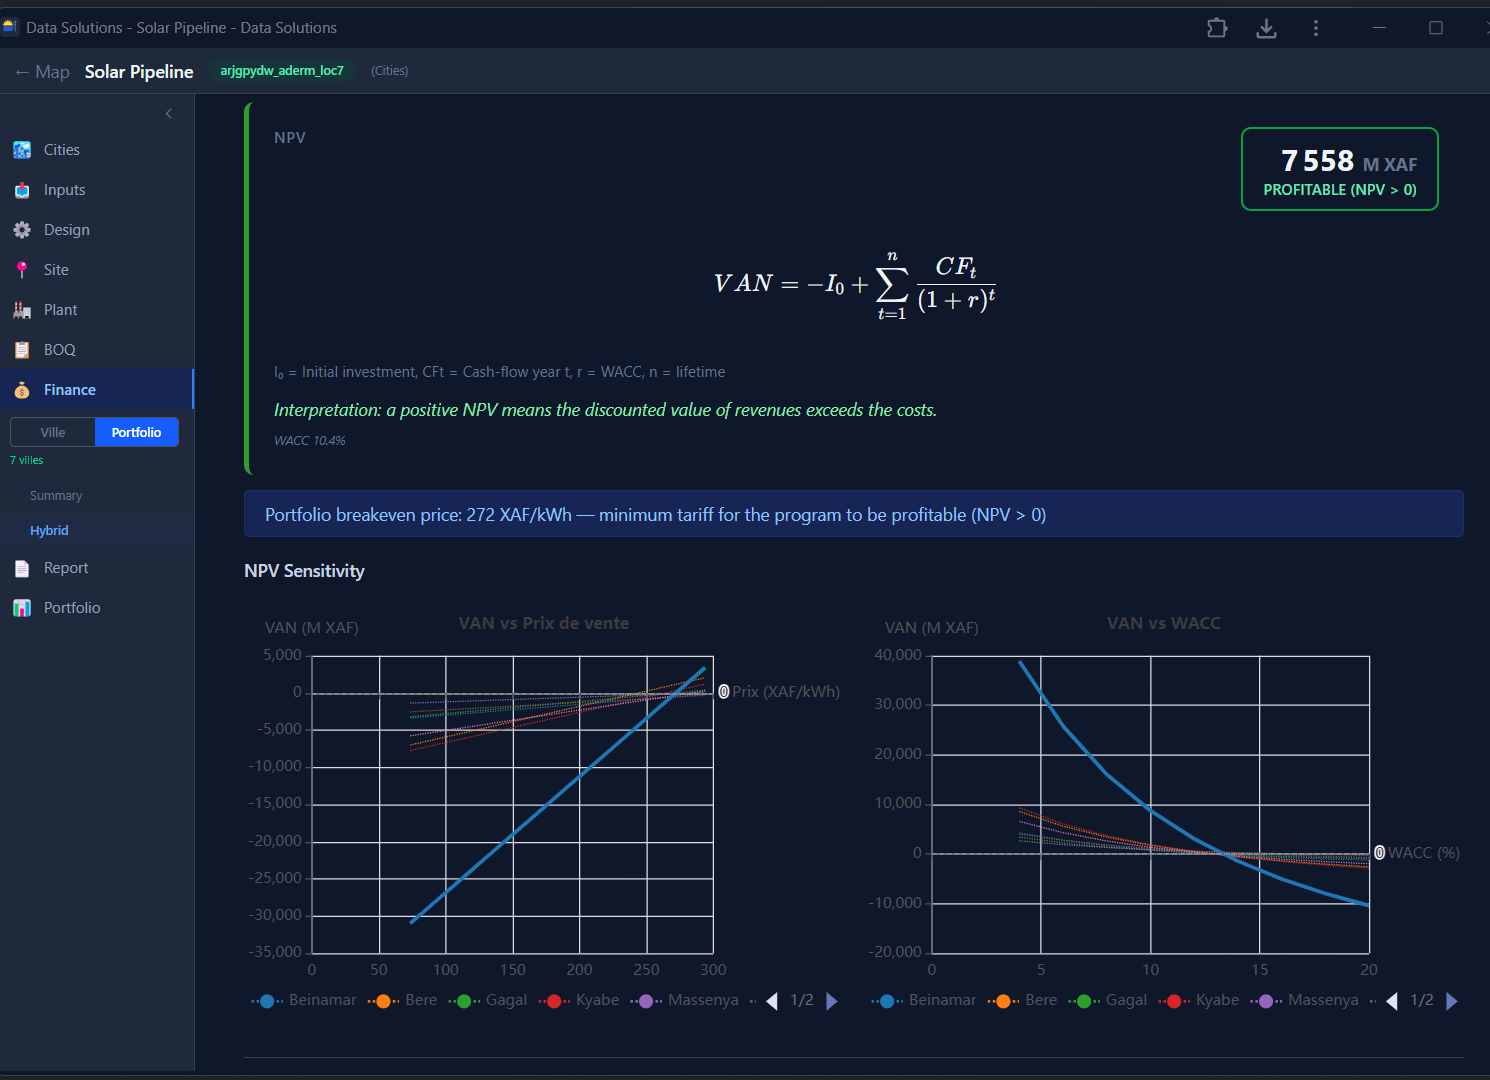
Data Solutions is a production platform for governed engineering data. It brings project roles, lifecycle states, survey dashboards, submissions, shared workspaces, cloud deployment, monitoring, and operational reliability into the same delivery environment.
Project operations stay visible while work is running. Delivery teams can track survey progress, submissions, form coverage, data integrity, review status, and handover readiness without separating project management from the technical record.
Software operations are handled as a professional engineering discipline behind the platform: monitored services, maintained deployments, controlled releases, backup practices, and reliability reviews keep the system dependable without turning client delivery dashboards into internal software dashboards.
Engineering datasets do not stay small. A utility-wide programme can accumulate large numbers of poles, spans, service drops, customers, photos, and attributes, and the design surface still has to feel workable. DS GridDesign is engineered around rendering performance: project features can be streamed, tiled, and queried so engineers can pan, zoom, inspect, and edit dense networks without splitting the job into fragile file fragments just to keep the workstation responsive.
Fast rendering only matters if the data behind it is sound. A carefully designed database keeps records indexed, consistent, and traceable as projects grow, so relationships stay intact and the same feature keeps the same meaning across field capture, design, outputs, and review. Good schema design is what lets the platform scale without the slow drift that creeps into spreadsheet-and-file workflows.
Scale that you cannot see is scale you cannot trust. The point is not only that large projects can load; it is that the engineer keeps full context while designing and planning. Existing assets, proposed design, field evidence, per-feature status, and reference layers stay visible together on one canvas, so decisions are made against the whole picture rather than an isolated extract.
Underneath, managed cloud infrastructure carries the load. Project data, imagery, evidence, and outputs are stored and served from services designed to grow from a single feeder to country-scale programmes without re-architecting the workflow, and without pushing that burden back onto manual file handling.
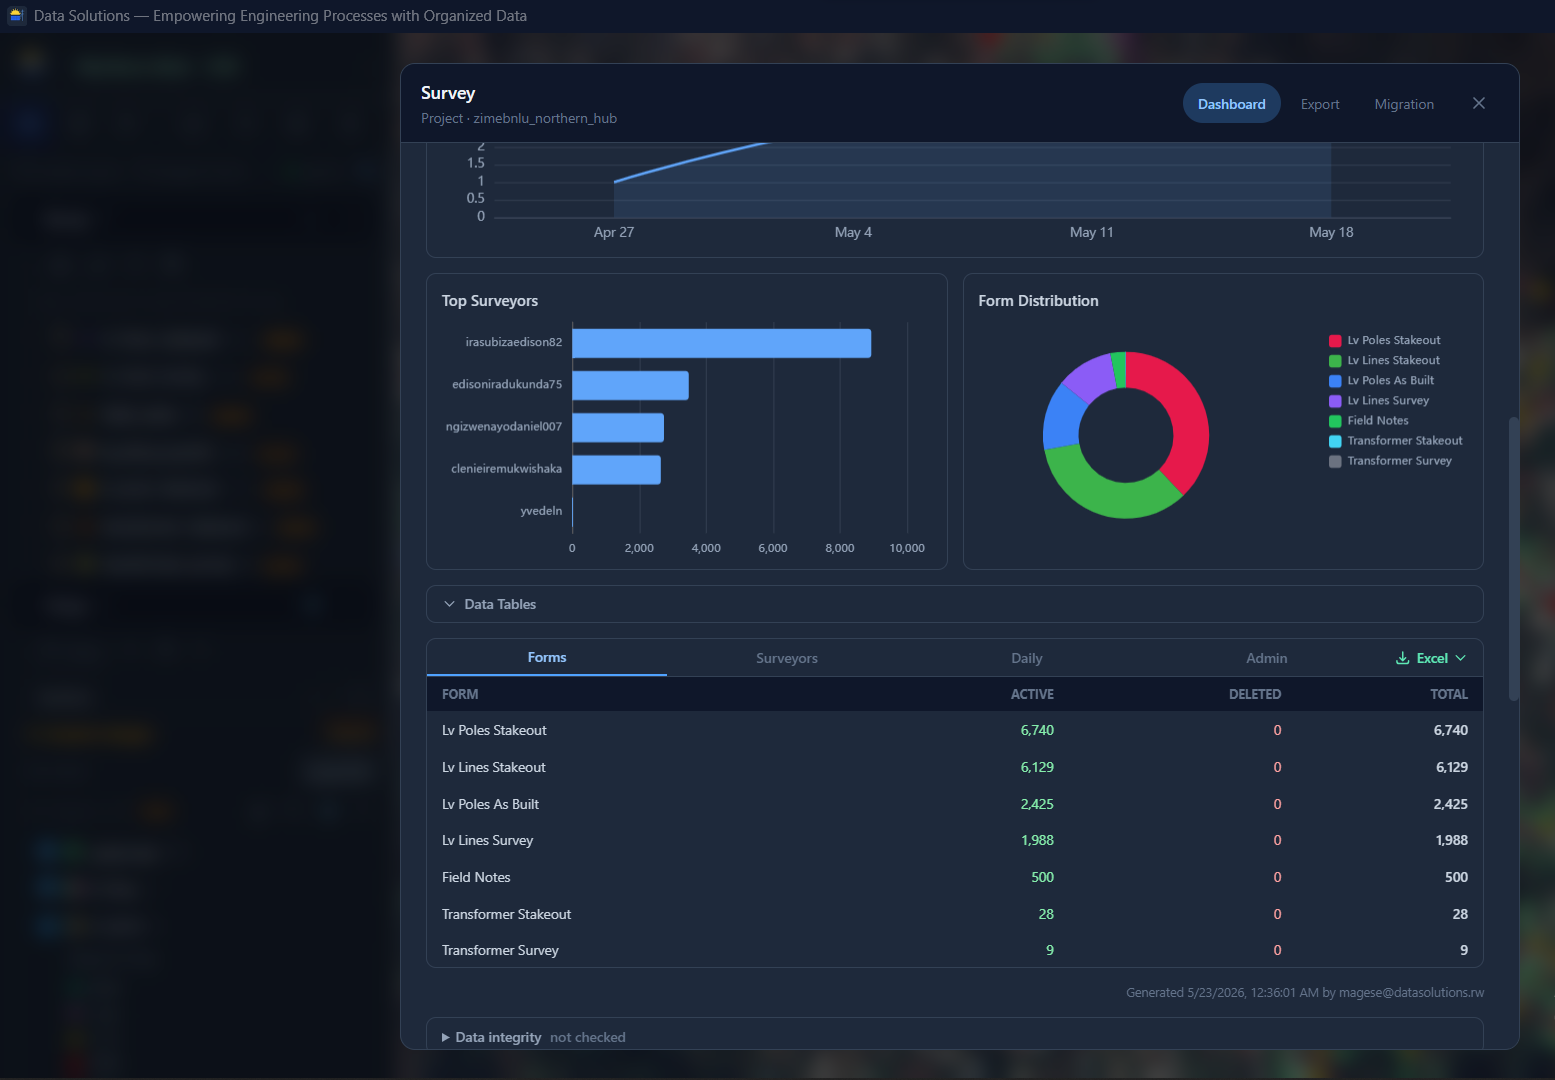
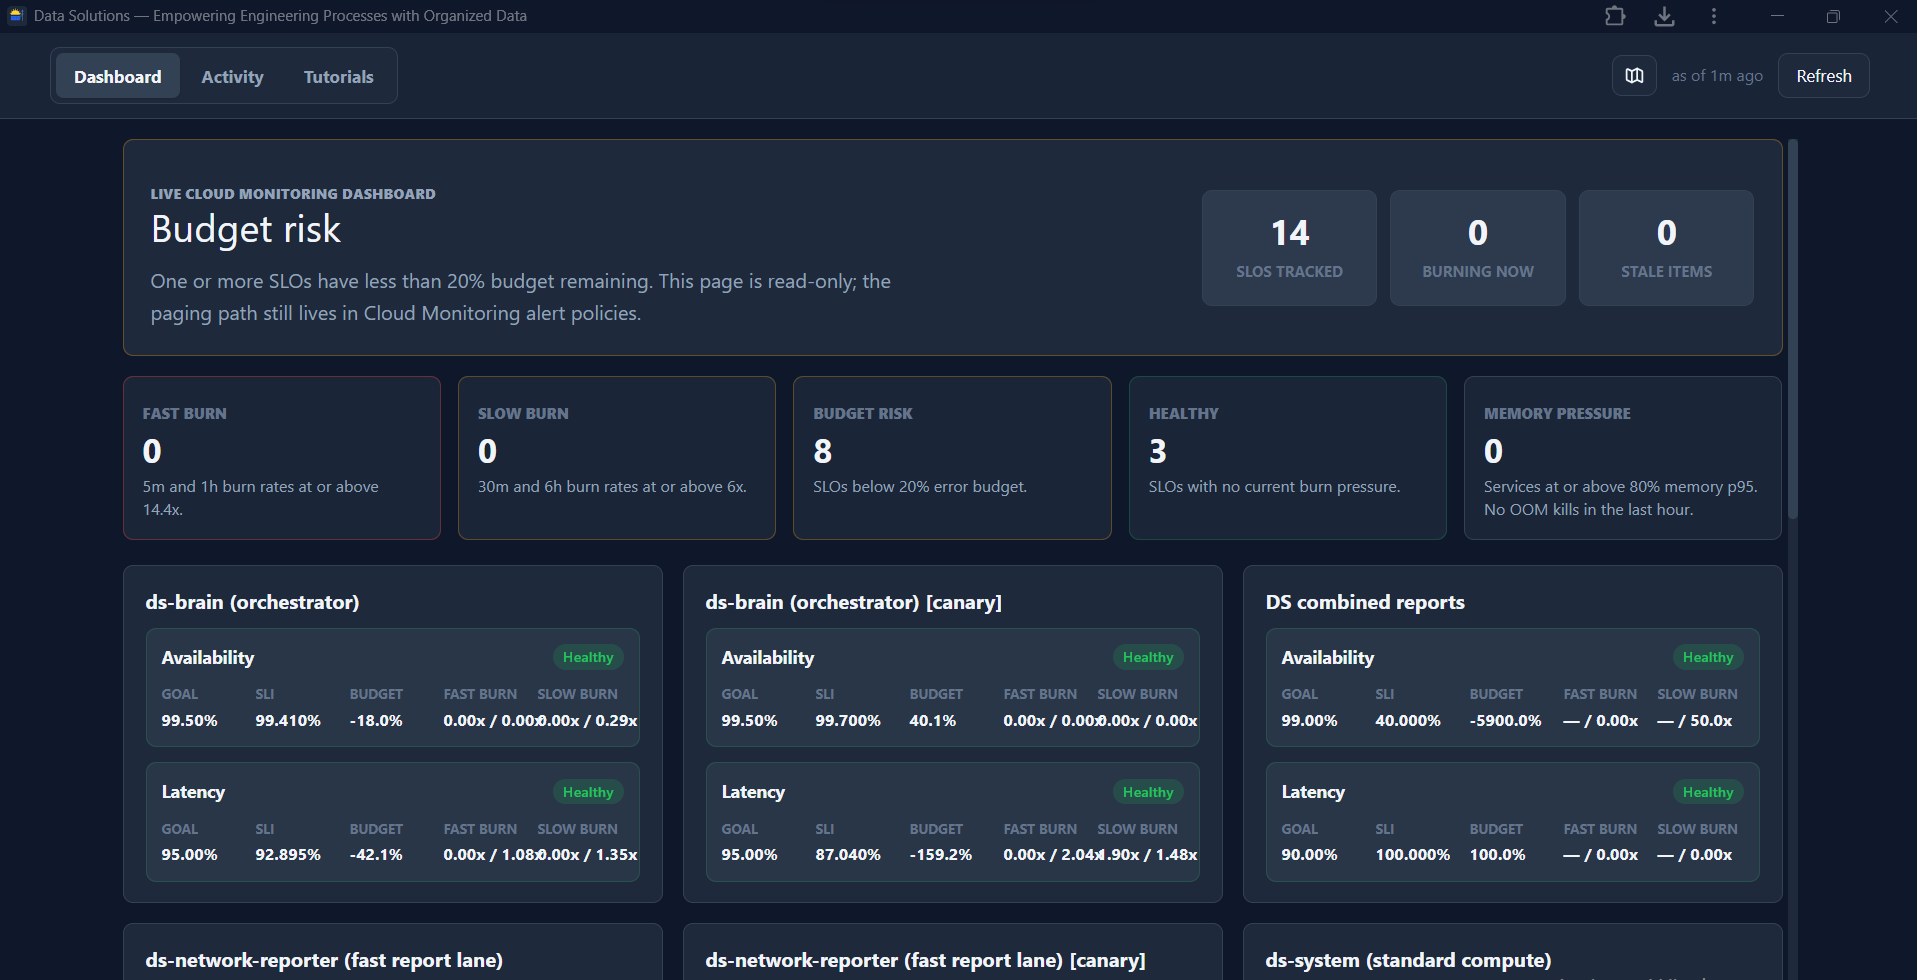
Platform foundations include:
Data Solutions is not only a codebase. It is built by people who have had to make engineering data work under field pressure: civil engineers, electrical engineers, surveyors, GIS specialists, software engineers, data engineers, and delivery leads who understand both the site and the system.
Civil and electrical engineering experience keeps the product connected to real design constraints, construction conditions, approvals, standards, and handover requirements. Survey experience keeps the forms practical in the field, not only correct in the office.
GIS and CAD specialists shape the layer models, naming rules, styles, coordinates, attributes, validation checks, and export formats that make project records usable by clients, contractors, designers, and operators.
Software and data engineers turn delivery knowledge into reusable systems: APIs, cloud services, databases, dashboards, computations, exports, monitoring, and workflows that can serve many projects without depending on manual file handling.
The team can help client staff adopt the platform quickly: configure forms, align layers and standards, train survey and office users, set review habits, and transfer practical knowledge without making every client start from zero.
Our teams have worked across different geographies, delivery languages, and working cultures. That experience matters when a workflow must adapt to local codes, client templates, approval habits, language, and field realities. Data Solutions can be configured or customized for multilingual project environments while keeping the same disciplined data backbone.
Hire Engineering Data Solutions to handle survey, logistics, data collection, design support, QA, reporting, and engineering deliverables end-to-end.
Hire Data Solutions specialists for a focused two-week onboarding to configure workflows, train staff, align forms and layers, set up QA processes, and make your team productive inside the platform.
This gives clients a practical path to start. Teams without capacity can buy delivery. Teams with existing people can keep their structure and upgrade the workflow around them.
Company: Data Solutions
Website: datasolutions.rw
Email: magese@datasolutions.rw
Phone: +250 783 000 360
Location: Kigali, Rwanda
Product line: DS Field / DS GridDesign / DS Solar